
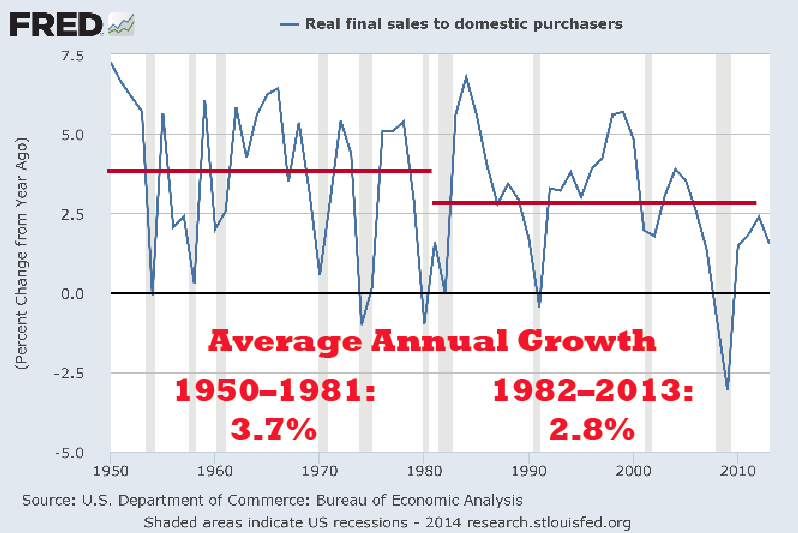
Years of >5% Growth:
Pre-Reagan? 15
Post-Reagan? 5
Post-80s-recession-recovery? 2

See the average annual growth of real final sales to domestic purchasers before, after and well after the Reagan Revolution.
Years of >5% Growth:
Pre-Reagan? 15
Post-Reagan? 5
Post-80s-recession-recovery? 2



Comments
Log in or sign up to join the conversation.