
Or, why I think Governor Brainard is right to say it’s too soon to tighten.
Tim Duy’s interpretation of the last FOMC statement as a dismissal of international concerns as laid out by Governor Lael Brainard is troubling.
The removal of international factors from the statement reminds me that we ignore the external conditions at our peril (see also Krugman’s take). Here’s a cautionary tale from my youth.
Thirty five years ago, I took my first course in intermediate macroeconomics. Professor James Duesenberry, a developer of an precursor to the model of habit formation in consumption theory [1] (the “habit theory”), was the instructor, and on the day after Ronald Reagan’s election, he took time out from the course to discuss the macroeconomic implications of the new president’s program of massive supply-side tax cuts and elevated defense spending on the US economy. He predicted – rightly – that purported unicorn-like (my words) supply side surges in tax revenue would not appear; he also predicted – rightly – that there would be massive crowding due to the collision of fiscal and monetary policy. Where he was wrong was where the crowding out would occur: it occurred in net exports, rather than in investment. I wonder if policymakers — particularly those schooled in thinking of America as a closed economy — are again about to under-estimate the openness of the US economy.
Here are some observations to keep in mind:
1. Trade is an increased share of GDP
During the mid 2000’s, net exports increased to record share of GDP – nearly 6%, dwarfing the international sibling of the “twin deficits” of the 1980’s experienced under Reagan. More importantly, the economy is more open: exports plus imports as a share of GDP is now around 30%, as compared to 25% between the previous two recessions, as shown in Figure 1.
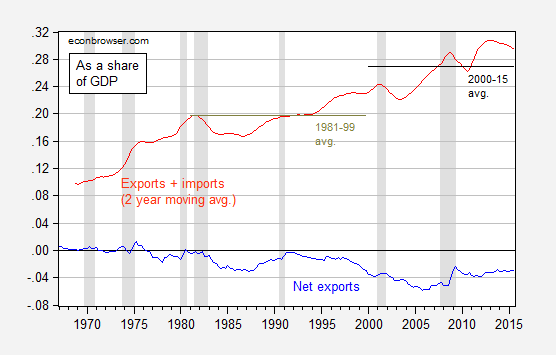
Figure 1: Nominal net exports to GDP ratio (blue), and nominal sum of exports and imports to GDP ratio, 8 quarter moving average (red). NBER defined recession dates shaded gray. Source: BEA, 2015Q3 advance release, NBER, and author’s calculations.
2. The relative importance of the contribution of net exports to growth has increased over time.
Using the decomposition of contributions to growth (in an accounting sense) as reported in Jim’s post on the GDP release, it can be shown that over time the absolute value of GDP growth (SAAR) has decreased, while the absolute value of net export contributions to growth has remained largedly unchanged.
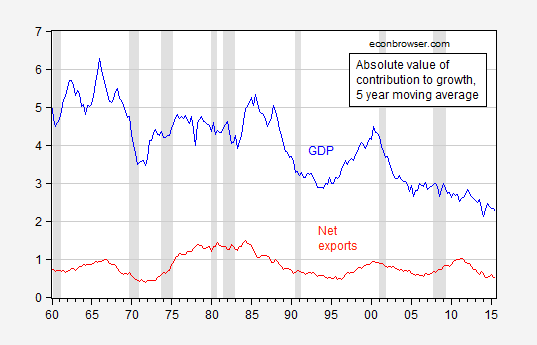
Figure 2: Five year moving average of absolute value of GDP growth (blue), and of net export contributions to growth (red), all SAAR, in ppts. Source: BEA via FRED, and author’s calculations.
3. The responsiveness of trade to exchange rates has risen
US exports and imports also appear to be more responsive to exchange rates than they were in previous periods. Hence, the observation that the recent appreciation has not reached heights recorded in the early 2000’s and in the mid-1980’s is not necessarily sufficient to dismiss worries. Inthis post (extended in Chinn (2010)) I report estimates that indicate that export price (exchange rate) elasticities are greater in the more recent period than in earlier; similarly IMF (2007) (Table 3.2) finds that price elasticities are higher over the 20 year period up to 2006 as compared to the entire 33 year period.
In this context, the 15% appreciation in the real value of the dollar, against a broad basket of currencies, shown in Figure 3, takes on greater significance than it might have in times past.
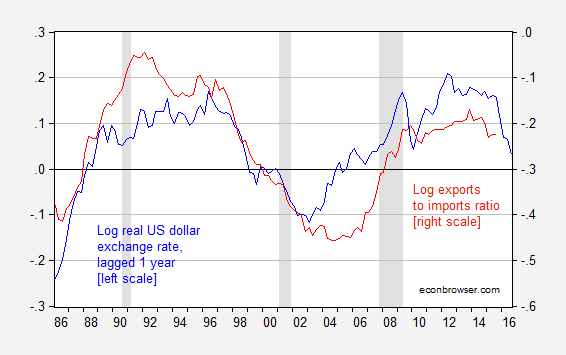
Figure 3: Log real dollar exchange rate against a broad basket of currencies, 1973M01=0, lagged one year (blue, left scale), and log real exports to imports ratio (red, right scale). Exchange rate defined so down is a dollar appreciation, so that the two series should exhibit positive correlation. NBER defined recession dates shaded gray. Source: Federal Reserve Board via FRED, BEA, NBER, and author’s calculations.
The impact of the rapid appreciation is yet to have shown up in exports and imports, if the past is any guide. Moreover, with the continuation of quantitative easing in the euro zone and the continued financial turmoil in China, there is little to suggest the dollar’s appreciated value will disappear anytime soon.
There is some indication of the dollar’s impact in indicators of tradables — approximated by manufacturing — activity.
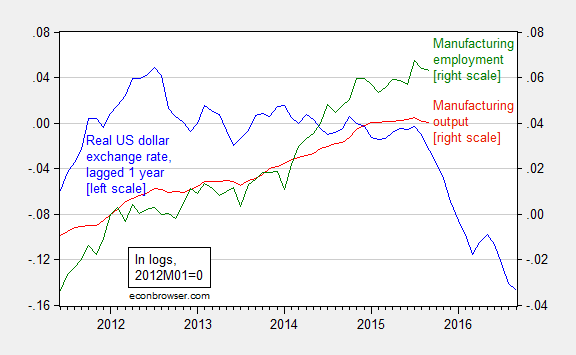
Figure 4: Log real dollar exchange rate against a broad basket of currencies, lagged one year (blue, left scale), and log manufacturing employment, s.a. (red, right scale), and log manufacturing output, s.a. (green, right scale), all series normalized to 2012M01=0. Exchange rate defined so down is a dollar appreciation, so that the three series should exhibit positive correlation. NBER defined recession dates shaded gray. Source: Federal Reserve Board via FRED, BLS, NBER, and author’s calculations.
With the US economy already exhibiting weakness, and the global economy in flux [2], it hardly seems the right time to appreciate the dollar, which tightening would likely do.


Comments
Log in or sign up to join the conversation.