
Another year has rolled around: markets have shrugged off tariffs and AI anxieties, to pick two choice examples, and headed higher. At least they had shrugged them off at the time of writing.
As a consequence, the world has grown ever-more lopsided. A recent study by FTSE Russell shows how country weightings have shifted over time. In September 1987, just before the Black Monday crash, the US stock market represented 37% of FTSE’s 23-country global equity index. The US then had roughly the same weight as Japan in the index. Now, while the FTSE All-World index has more than doubled the countries it encompasses, the US weighting is 63%, and Japan 5.7%. No other country has more than a 5% weight in the index. The FTSE All-World index is not just concentrated in terms of country weightings, but by sector and stock:
“Although the index has 4254 constituents, 24% of the index by weight was represented by the top ten holdings. All but one of these were US stocks with a heavy focus on technology and the ongoing artificial intelligence (AI) boom—and the other was Taiwan’s TSMC (TSM), the leading manufacturer of semiconductors.”
First world problems?
The reference to TSMC demonstrates that de-risking equity portfolios isn’t simply a matter of going ex-US and waiting for a correction. Over the first 11 months of the year, the FTSE Emerging index returned about 25%. TSMC returned nearly 40% over the period and is more than 11% of the index. The stock was therefore responsible for about 4.6% of the YTD total return, or about 19% of the index’s return. The stock is, of course, closely bound up with the theme that has driven the bulk of S&P 500 returns given it’s selling the shovels to the AI gold rush.
If the US looks pricey, therefore, other equity markets don’t offer easy choices. Admittedly, few are as expensive as the US, but all major markets are richly valued compared to their history.
There can be good reasons for paying up a rich price for a stock. For example, technology companies trade on higher price-earnings ratios than utilities because the growth expectations for the former are higher than a water company. But it’s also true that there is considerable research demonstrating an inverse relationship between equity market valuations and future long-term returns. High valuations often signal lower returns, especially in large-cap, growth, and broad equity indices—something outlined in another FTSE Russell paper.
Hardly coincidentally, large-cap, growth, and broad equity indices is where we are seeing the bulk of money going, further inflating multiples.
British exceptionalism?
There’s a strange twist to this, however, in that UK fund buyers haven’t been riding this bandwagon—at least in aggregate. Over the first 11 months of 2025, the top-selling Lipper Global Classifications in the UK were Money Market GBP (+£18.88bn), Mixed Asset GBP Aggressive – Global (+£9.89bn) and Bond Global USD (+£4.69bn).
Equity sectors barely get a look in: counterintuitively, global small- and mid-cap funds (+£2.01bn) were the best-selling equity classification, followed by equity market neutral (+£1.1bn) strategies—the latter perhaps understandable from British risk-averse investors.
Chart 1: Best-selling Lipper fund classification in the UK, 1 January-30 November 2025
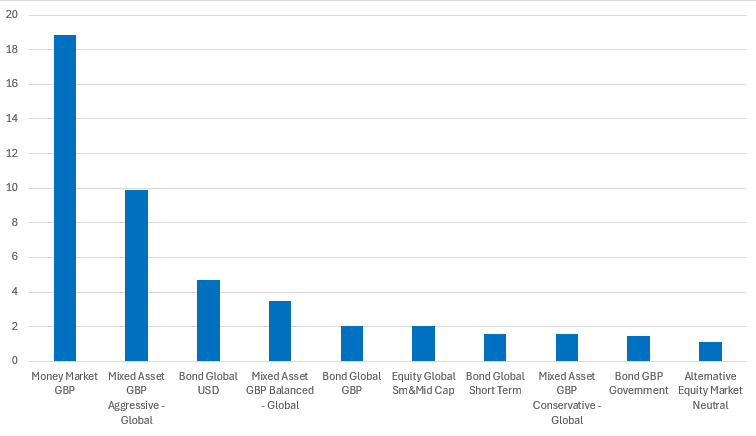
Source: LSEG Lipper
The most heavily sold off classifications were Equity UK (-£16.92bn), Equity US (-£13.26bn), and Bond Global Corporates GBP (-£13.07bn). So, it seems UK investors are steering clear of those pricey US mega caps—the same being true for US-heavy Equity Global funds (-£9.84bn).
Chart 1: Most redeemed Lipper fund classification in the UK, 1 January-30 November 2025
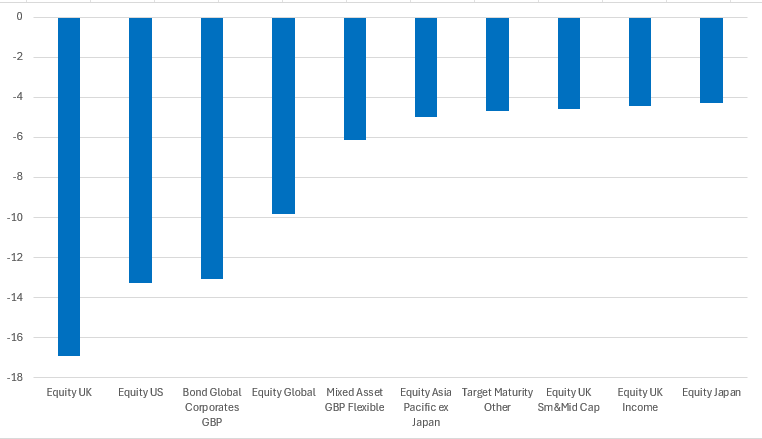
Source: LSEG Lipper
Things look rather different in Europe. Over the first 10 months of the year, Equity Global was the third-best selling classification (+€59.21bn). Equity US funds don’t make either end of the table but rather sit in twenty-third place (+€7.81bn). These figures include UK flows: excluding them would make the contrast between the UK and continental Europe greater, with Equity Global and US funds seeing larger net inflows.
Unlike Europe overall, the UK market has seen large equity fund redemptions over the past year. That said, UK investors have been nibbling away at global emerging markets (including frontier markets) and European allocations, among others.
This all seems a little odd. After all, risk models don’t differ that much, and it’s perhaps surprising that equity buying signals point in opposite directions depending on which side of the English Channel you sit. One possible reason for the UK’s divergence from Europe is the buying effects of LDI-driven UK pension funds, which are intrinsically more equity-averse than the broad market.
Equity alternatives
Over the longer term, US large-cap exposure has benefited investors. The market’s valuations are so high because of this. One may choose to continue to ride the wave—after all, it has defied the gloom so far. But if those valuations are keeping you awake at night, there are numerous ways of mitigating this, even passively: within US large caps, it’s possible to go equal weighted rather than cap weighted. Cap weighted S&P 500 ETFs have significantly beaten their equal weighted peers over one, three, five and 10 years, but the elastic must snap back eventually…whenever that may be.
One need not be constrained by the strictures of the global equity index for performance measurement, either. A simple alternative could be to combine a US index with a global ex-US index, with the former at a lower weighting than for the whole-of-world weighting, for portfolio construction and performance measurement.
You may be happy with the world’s lopsidedness. But if you’re not, there are always alternatives.


Comments
Log in or sign up to join the conversation.