


Where is the money invested in ETFs actually allocated? This is a question which market observers and investors are asking. Obviously, an analysis of the assets under management by asset type shows which asset type investors prefer and which might emerge over time. That is clearly a good starting point for any analysis, but only an analysis at the classification or peer group level, does show in which kind of equities or bonds the money is invested in detail.
That said, the assets under management in the global ETF industry are split into 306 different Lipper Global Classifications which makes it quite hard to summarize the invested assets in a specific region, theme, sector, or bond type. To solve this issue, a view on macro classifications may help to get a better understanding of the market.
Equity ETFs
To build the respective macro classification for all equity ETFs globally we have chosen U.S. Equities, Global Equities, Equity Sectors, Indo-Pacific Equities, Global Emerging Markets Equities, European Equities, Themed Equities, and all other equity classifications summarized as Equities – Rest of the World.
These macro classifications contain more than just the respective ETFs with a regional investment approach. European equities, for example, contain the following classifications: Equity Europe, Equity Europe ex UK, Equity Europe Small & Mid Cap, Equity Nordics, etc. In addition to these regional ETF classifications, it also contains Equity Germany, Equity Germany Small & Mid Caps, Equity France, Equity Italy, Equity UK, etc. Hence, these macro classifications really summarize all assets in ETFs globally invested under the respective investment objective.
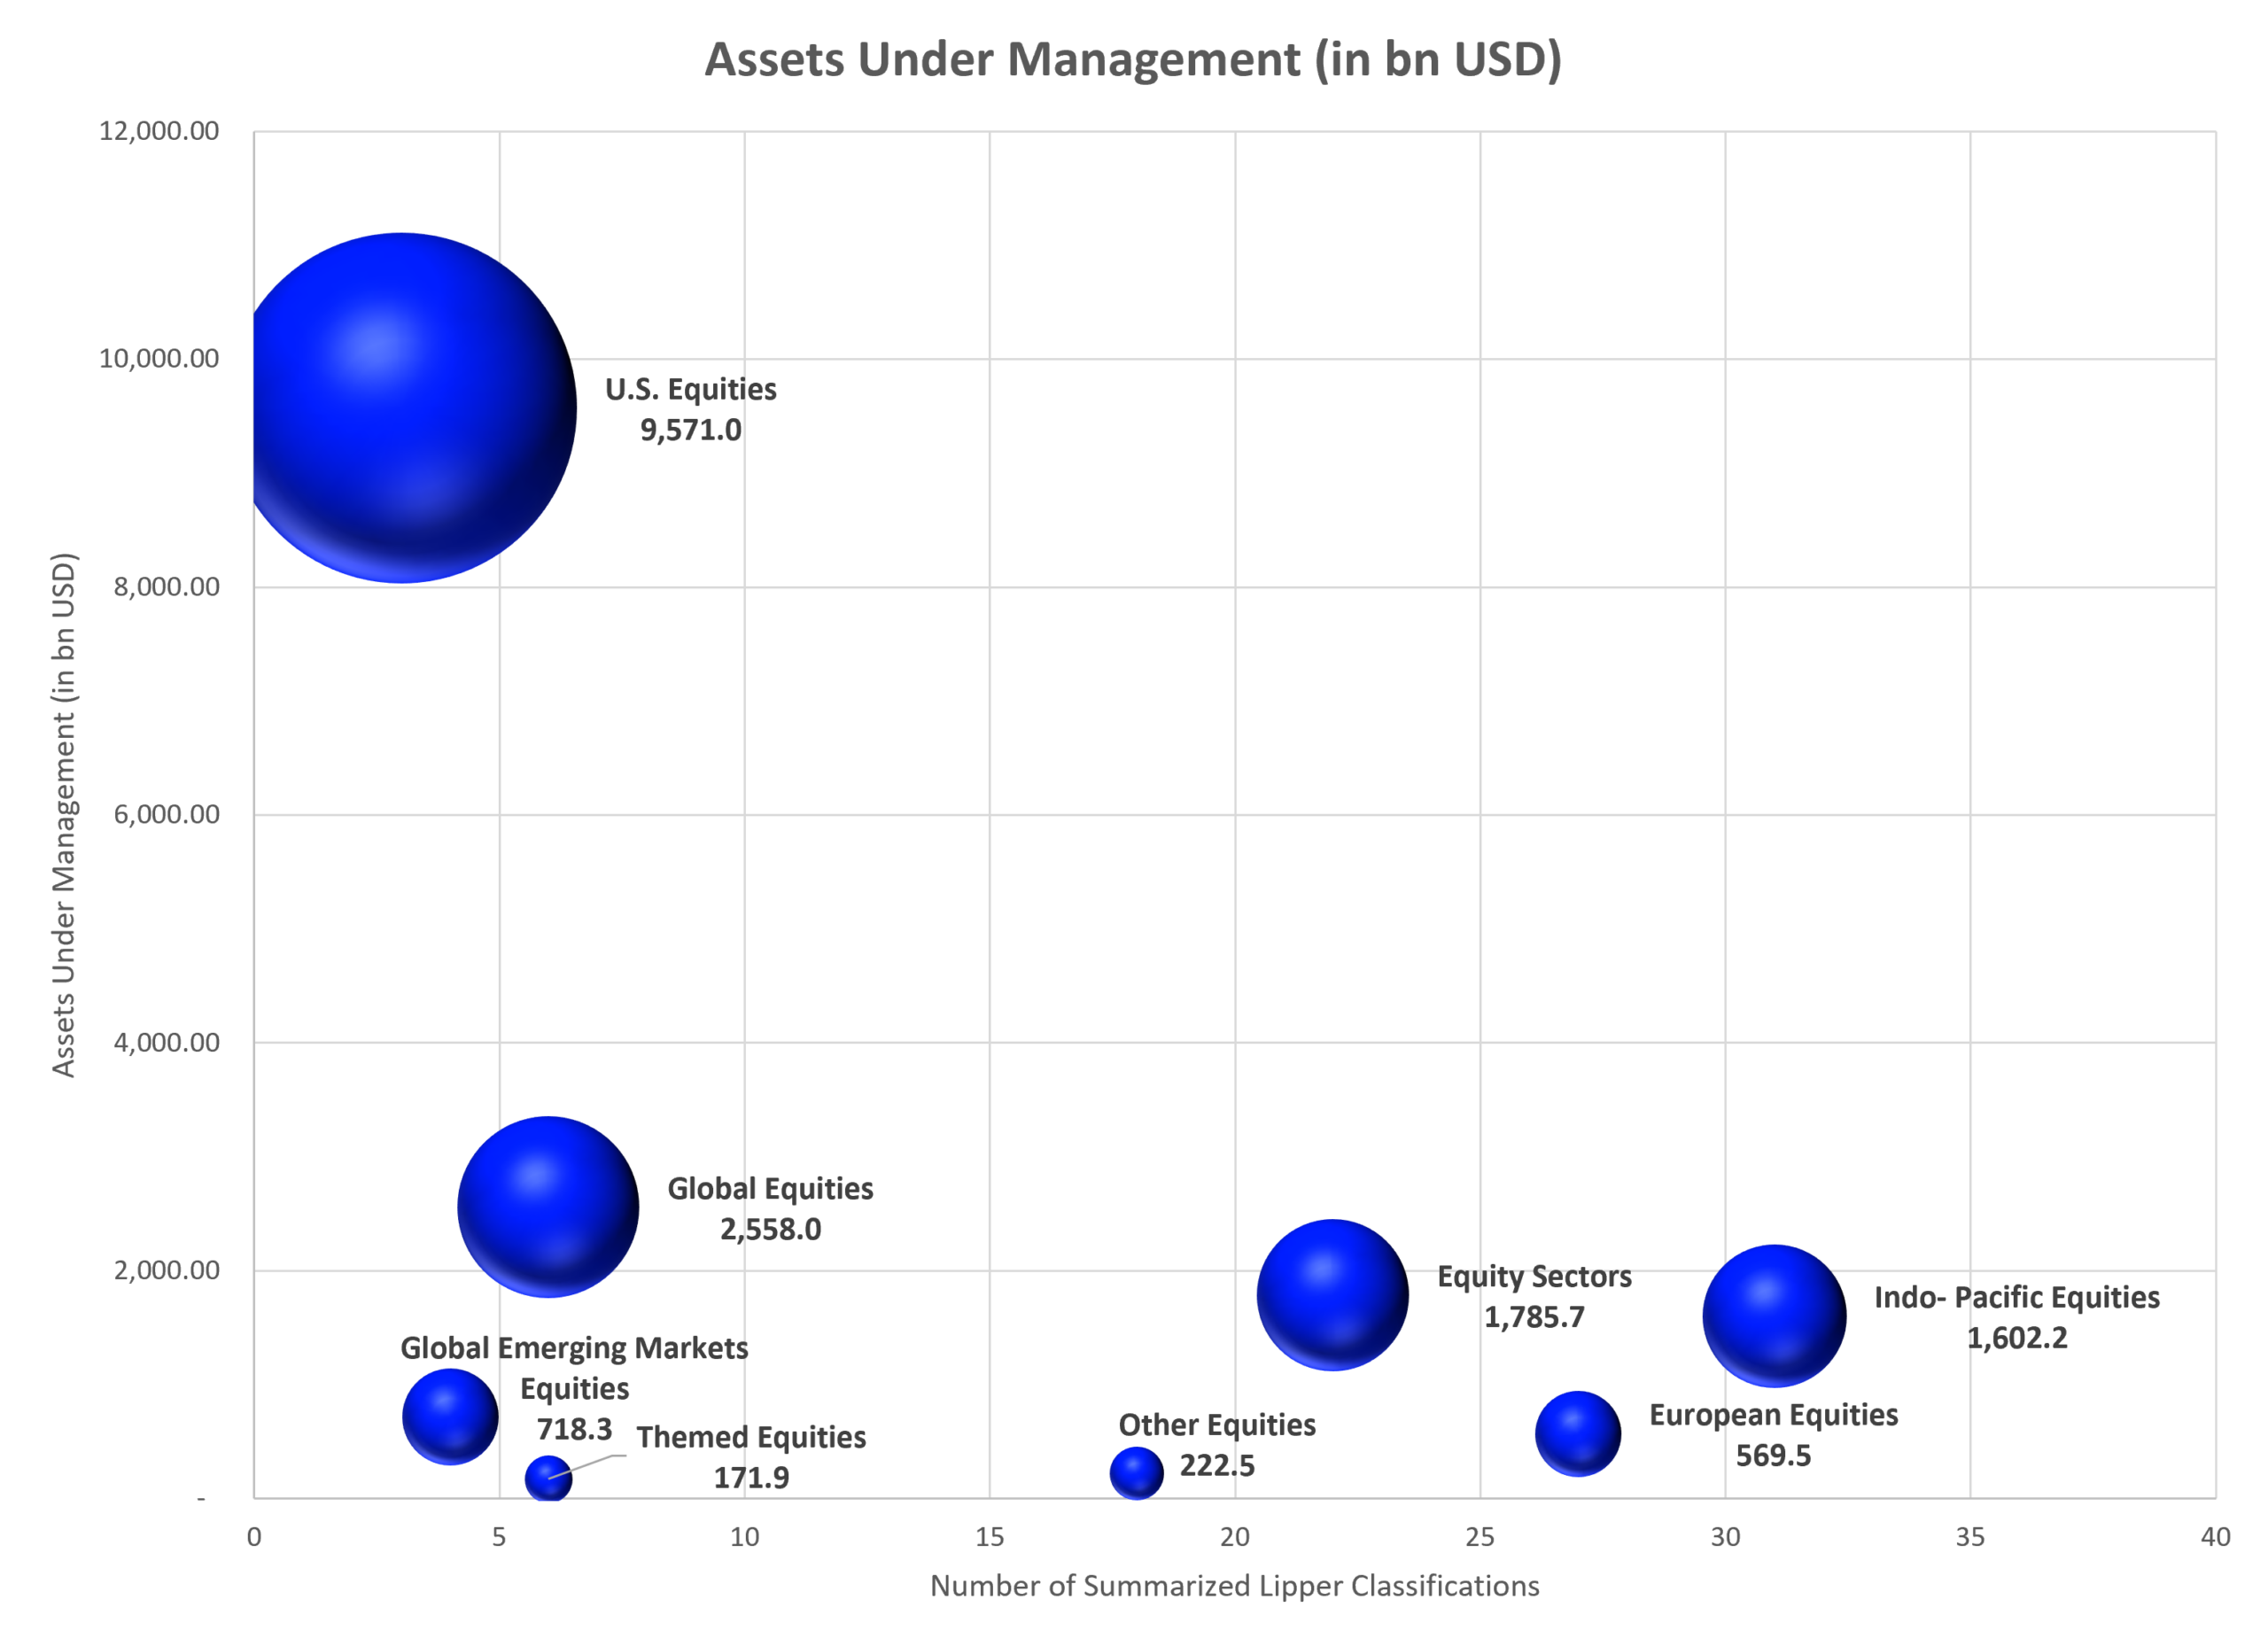
Graph 1: Assets Under Management (in bn USD) and Number of Summarized Lipper Global Classifications for Equity ETFs
Source: LSEG Lipper
As graph 1 shows, U.S. Equities is by far the largest macro classification for equity ETFs in the global ETF industry despite the fact that this macro classification only contains three Lipper Global Classifications. Nevertheless, it was to be expected that U.S. equities would be leading the table since the global ETF industry is heavily impacted by the U.S. ETF industry and Equity U.S. is the dominating Lipper classification in the U.S.
That said, one key finding of this chart is that ETF investors around the globe seem to underweight European equities. This is because the overall assets under management invested in ETFs in this macro classification are either investing in regional or in a single country ETFs.
Bond ETFs
We used the same approach for equity ETFs and bond ETFs to create respective macro classifications for all bond ETFs globally. These classifications are Government Bonds, Medium Term Bonds, Short Term Bonds, Corporate Bonds, High Yield Bonds, Emerging Market Bonds, Inflation Linked Bonds, and Global Bonds, while all remaining bond classifications are summarized as Other Bonds.
If a respective bond classification could be classified in two different macro classifications, we have chosen the issuer over maturity. Hence, the Lipper Global Classification Bond Corporate Short Term is summarized in the Corporate Bonds classification and not under Bond Short Term.
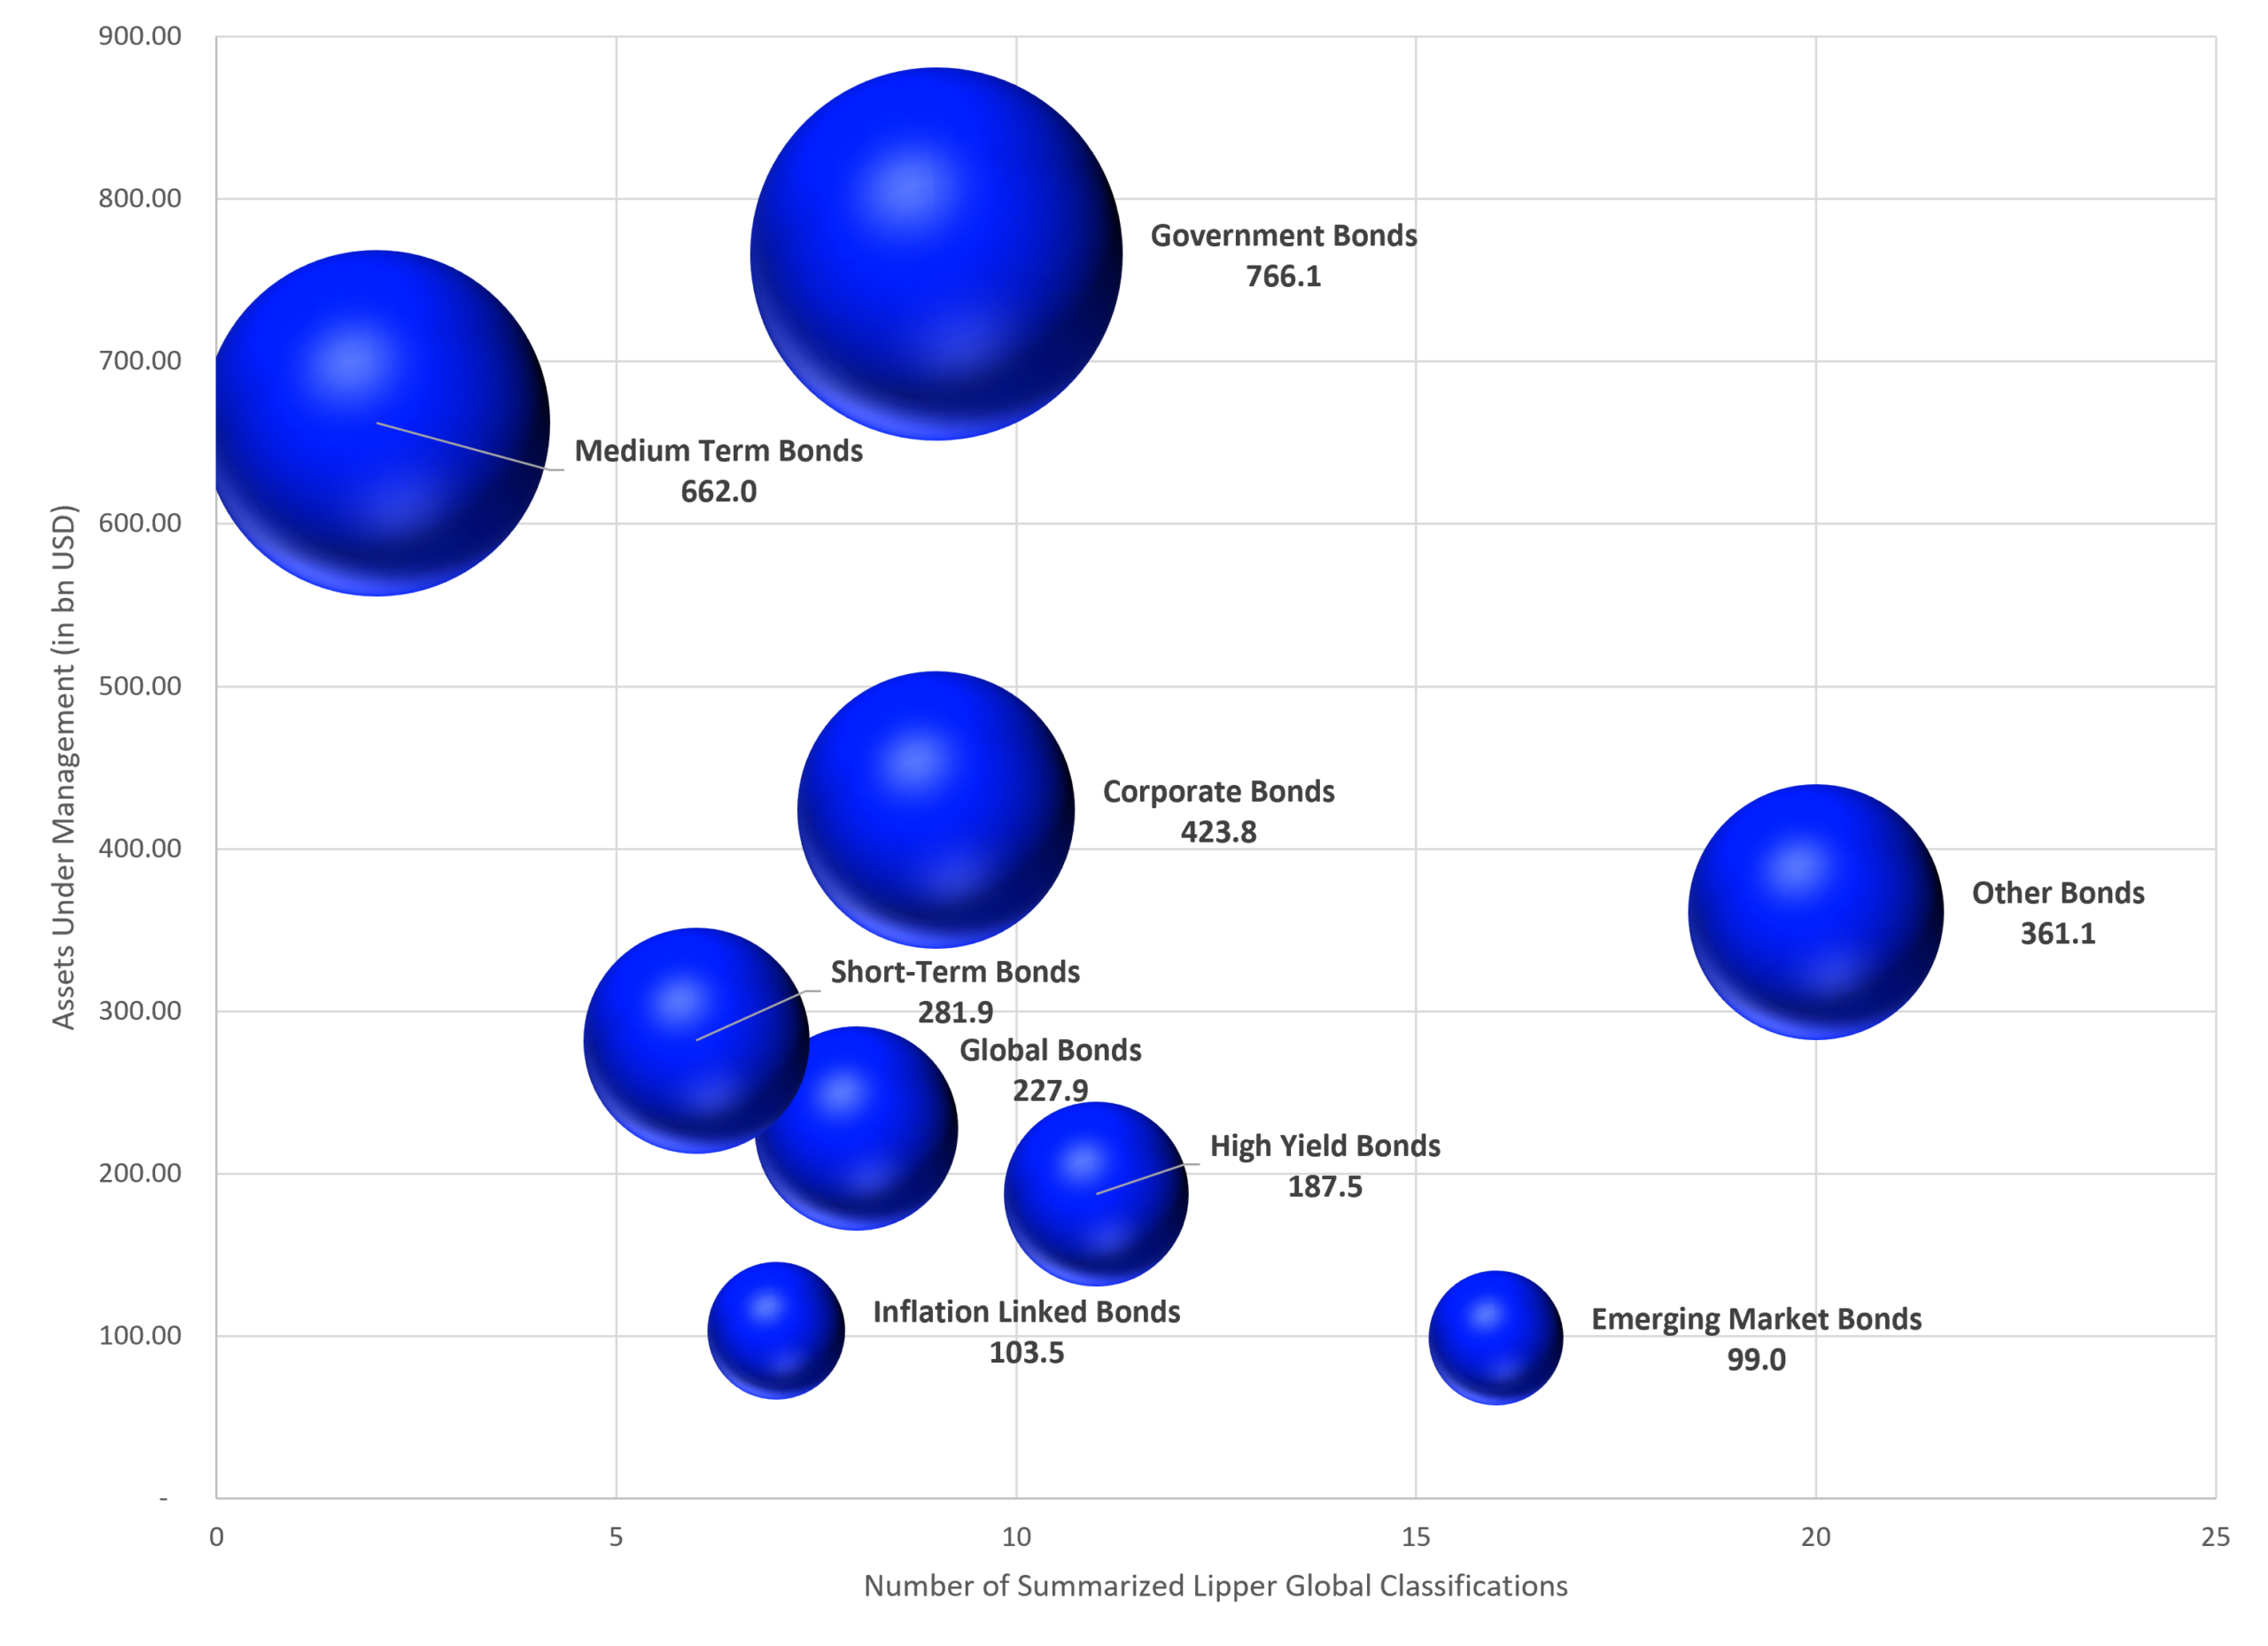
Generally speaking, graph 2 looks somewhat as expected. Nevertheless, the level of assets under management invested in the Medium Term Bonds classification is somewhat unexpected, especially as this macro classification only summarizes two Lipper Global Classifications (Bond USD Medium Term and Bond USD Municipal Medium Term).
Graph 2: Assets Under Management (in bn USD) and Number of Summarized Lipper Global Classifications for Bond ETFs
Source: LSEG Lipper
Another surprise might be the relatively large size of the Other Bonds classification. But as one can see from the x-axis, this classification contains a high number of Lipper Global Classifications. It contains the single currency bond ETF classifications, which includes Bond USD, which alone holds nearly half of the assets of this macro classification.
Summary
Overall, the results for the bond classifications show that the assets under management of bond ETFs globally are even more impacted by ETFs domiciled in the U.S. than the results for equity ETFs.
That said, both graphs deliver a good overview of investor preferences and the overall structure of the global ETF industry, measured by how the assets are invested. Unfortunately, this analysis does not give any hints about future fund flows. So, the fund flows in the global ETF industry need to be observed separately to identify the underlying trends.
A more detailed view on both charts may give ETF promoters a hint where they can find some gaps in the overall product offering to position themselves in a space which is not so crowded as the main (plain vanilla) classifications.



Comments
Log in or sign up to join the conversation.