


Despite the market rally, there is one key sector not participating: financials.
Even as the indexes make new all-time highs, the XLF financials ETF continues to drift lower.
With everyone focused on semiconductors, it’s easy to dismiss the laggards…but…there might just be a hidden opportunity.
You see, the Block Hunter Console pulled three prints this morning:
JPMorgan (JPM) took a 3,517-contract block put at the 275 strike for July 2
KRE (the regional bank ETF) printed a 25,000-contract put spread at 69/67
Bank of America (BAC) cleared 54,000 contracts on its chain, with 49% of the put side filling at the ask
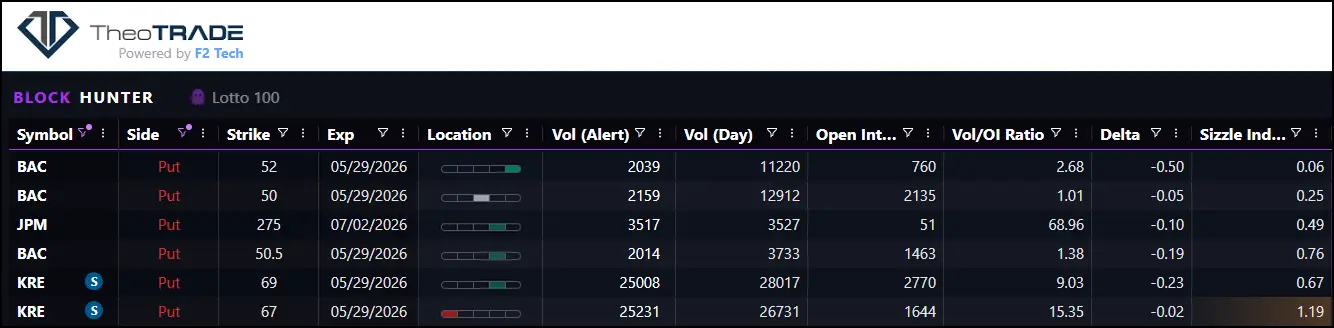
Three different banks, three different expirations, all pointing in the same direction – down.
That kind of alignment is rare, and it almost never shows up by accident.
When three of the largest names in a sector see coordinated put activity in a single session, the institutions behind those trades are pricing in something the index isn’t showing yet.
The clue to where they think it goes is sitting in the XLF chain itself.
Here’s the thing – there’s a specific price where the slow drift turns into a forced move, and a 56-cent spread that pays close to 70% if XLF gets there.
Here’s how the structure sets up.
Why XLF Is Lagging The Rally
The financials sector has been moving sideways to down while the S&P 500 prints new highs. That gap matters.
When one sector refuses to participate in a broad rally, it usually means the institutions positioned in that sector see something the index doesn’t reflect.
Semiconductors are pulling the index up. Financials are getting left behind, and the put activity this morning suggests that’s not an accident.
The yield curve is part of the story. Long-term yields have been drifting lower, and there’s pressure on short-term rates from policy expectations.
A flatter curve squeezes the spread between what banks borrow at and what they lend at. That spread is how banks make money on every loan they write.
Oil weakness compounds it. Energy companies borrow heavily from regional banks, and a softer oil tape pressures the loan book on the regional side.
None of this is new information. What’s new is institutions sizing the trade today.
The JPMorgan Block
The JPMorgan print is the cleanest signal of the three. 3,517 puts at the 275 strike for July 2 expiration, bought in a single trade.
That’s a six-week timeframe. The institution behind it is positioning for a specific move, not buying disaster insurance.
JPMorgan is the bellwether for the entire money center bank group. A trade this size at a strike below current price says the buyer expects a fade through 275 inside that window.
The KRE Confirmation
KRE is the regional bank ETF, and it’s where the curve flattening hits hardest.
The print today was a 25,000-contract put spread at the 69/67 strikes. That’s a defined-risk bet that KRE breaks 69 and rolls down toward 67 over the coming weeks.
Regional banks live off the spread between deposits and loans. Flatten that spread and earnings compress fast.
The size of the spread trade matters. 25,000 contracts is a position, not a hedge, and it lines up with the broader bearish read in financials.
The Bank Of America Aggregate Read
Bank of America didn’t print a single block. The signal showed up in the aggregate flow instead.
54,000 contracts cleared the chain today with 49% of the put side filling at the ask against 27% at the bid. That’s a clear buy bias on puts.
No single trade carried the day. Dozens of mid-sized prints stacked into the same direction across the session.
When the block alerts stay quiet but the aggregate ratios skew this hard, the Console reads it as institutional money sizing in pieces.
Where The XLF Cliff Sits
The three names roll up into XLF as a single read. The ETF’s chain shows 231,000 puts against 35,000 calls in open interest.
That ratio creates a negative gamma structure below 51. Dealers who sold those puts have to sell stock to stay hedged as price drops, and the selling accelerates the move.
There’s almost nothing on the call side to slow it down. The next significant call wall doesn’t show up until 54, well above current price.
If XLF breaks 51, the mechanical selling has a clean path to 50. Below 50 the put open interest stays heavy, which means the gamma pressure continues until well past that level.
The Trade
The structure pays the read without requiring a directional call on a specific catalyst.
Buy the XLF July $51.50 put
Sell the XLF July $49.50 put
Spread width: $2.00
Cost: approximately $0.56 per spread, verify on the chain at entry
Max risk: cost of the spread per contract
Max profit: $2.00 minus cost if XLF closes at or below $49.50 at July expiration
Direction: Bearish on financials, sized for the gamma cliff break
Catalyst: yield curve flattening, oil weakness, coordinated put activity in JPM, KRE, and BAC
Target exit is roughly 70% of max gain. That hits when XLF trades near 50 and the spread approaches $1.00.
The trigger is a daily close below 51 with the put flow holding. If XLF reclaims 51 on volume, the read breaks and the trade should be closed.



Comments
Log in or sign up to join the conversation.