

Biotechnology stocks like RXRX are the ultimate battleground for market liquidity. To the untrained eye, a biotech chart looks like an unpredictable landscape of random gaps, violent selloffs, and inexplicable volume surges. Inexperienced traders often treat these charts like lottery tickets, attributing massive price moves entirely to clinical trial data or headline-driven retail hype.
However, if you understand Volume Price Analysis (VPA) and the structural laws of market mechanics, you know that the chart doesn’t lie. It provides a visual diary of institutional intent.
By applying Richard Wyckoff’s Third Law—The Law of Effort vs. Result—we can peel back the curtain on one of the most structurally fascinating charts in the market today: Recursion Pharmaceuticals, Inc. (Nasdaq: RXRX).
This deep-dive forensic analysis flips the traditional chart-reading script. We will start with today’s immediate technical setup, establish the core VPA theory your trading demands, and then travel backwards through time to unmask the hidden institutional tug-of-war, corporate dilution machinery, and massive liquidity sweeps that define this long-term accumulation base.
The Present Reality: Mapping the Current RXRX Framework
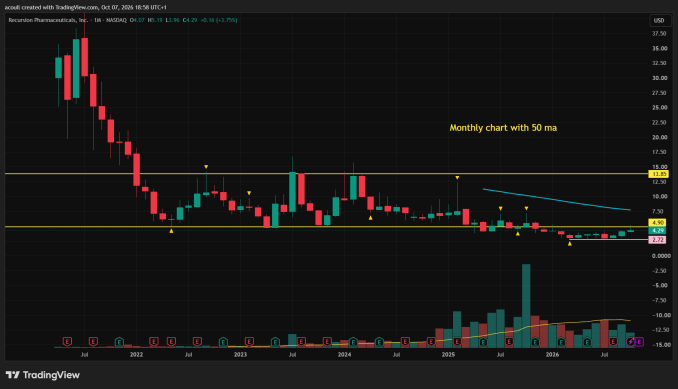
Before we look back, we must anchor ourselves in the present. As of October 2026, the technical boundaries on the $RXRX macro chart are remarkably defined. The stock is coiled inside a multi-year consolidation box, forcing market participants into a game of strategic patience.
The Near-Term Moving Average Confluence
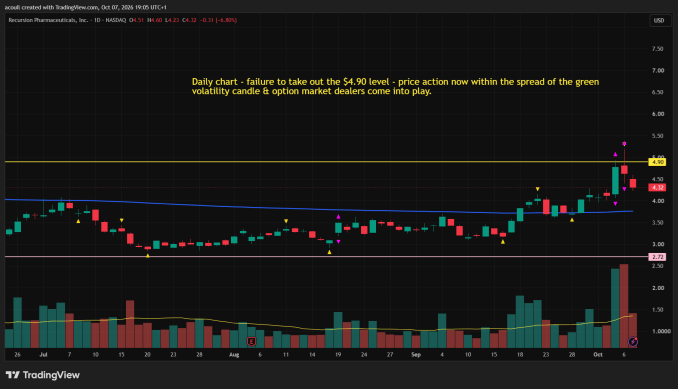
On the daily chart, RXRX is trading above its 200-day moving average (MA). This is a critical psychological line in the sand for swing traders, shifting short-term bias from bearish to cautiously bullish.
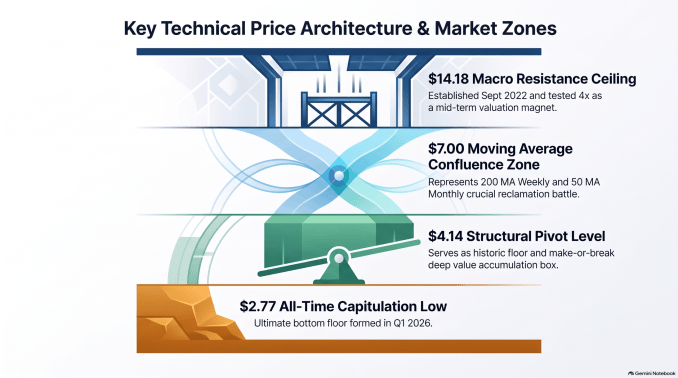
However, the weekly chart presents a more formidable obstacle: the price remains pinned beneath its 200-week moving average, which currently lines up in the $7.00 region, while the monthly chart has the 50-week MA in the same area.
To contextualise this, we look to a timeless market axiom popularised by the late legendary investor Charlie Munger: If an investor strictly disciplines themselves to buy only high-quality companies when they trade cleanly above their 200-week moving average, they instantly eliminate a massive layer of structural market risk.
For RXRX, that $7.00 zone represents a major structural trend-alignment magnet. A breakout above the immediate $4.14 pivot level opens the path directly to a test of that macro moving average confluence.
The Fundamental Health Check: Corporate “Breathing Space
Unlike standard tech stocks, pre-revenue biotech firms cannot be analysed solely by traditional earnings multiples. Their survival relies on a simple calculation: Cash Runway vs. Burn Rate. After a period of severe equity dilution and the strategic completion of its all-stock acquisition of computational chemistry peer Exscientia (EXAI), Recursion’s corporate “plumbing” has stabilised.
According to its latest SEC financial disclosures, Recursion has aggressively managed its expenses, slashing its annual operating cash guidance down to $375 million. Backed by a robust treasury of $556.8 million in cash, cash equivalents, and restricted cash, management has successfully engineered an operational runway that extends cleanly into early 2028.
This financial breathing space is vital for market participants to understand. It means the company is fully funded to carry out its complex clinical research pipelines without the imminent threat of supplementary, market-crashing capital raises.
Core VPA Theory: Wyckoff’s Third Law and the Anatomy of an Anomaly
To decode this stock’s historical footprint, we must establish the principles of Volume Price Analysis. Every candle on a chart represents a completed transaction, but volume represents the raw energy—the cash flow—that fuelled it.
A core concept of VPA is Richard Wyckoff’s Third Law: The Law of Effort vs. Result.
Effort is measured explicitly by the volume bar at the bottom of the chart. It represents the total amount of capital or shares changing hands.
Result is measured explicitly by the price spread of the candlestick (the absolute distance between the High and the Low.
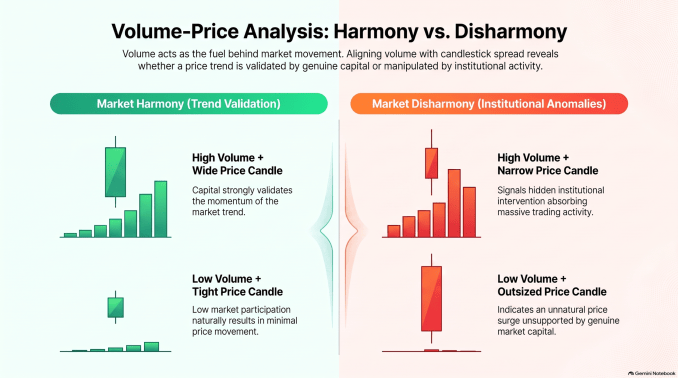
When a market is functioning in harmony, a large volume bar (High Effort) yields a wide-spread price candle (High Result). Conversely, a small volume bar (Low Effort) yields a narrow price candle (Low Result).
The Flashing Red Light
The true edge in trading comes when these two components fall out of harmony. This mismatch creates a VPA Anomaly.
When you see huge volume printing on a candle with a narrow body (with or without an upper wick), Wyckoff’s law tells us that the effort did not yield the expected result.
An anomaly is a structural warning sign that something untoward is happening behind the scenes. At the exact moment the candle prints, a trader rarely knows the exact fundamental reason why it occurred,
Meanwhile, the VPA structure flashes a warning to exercise extreme caution. It signals that institutional market makers are stepping into the market to systematically absorb supply or distribute shares, overriding organic public order flow.
The Forensic Investigation: Deconstructing RXRX’s Historical Anomalies
To understand how RXRX wound up in its current state, we must conduct a forensic chart investigation, travelling backwards through the timeline to dissect the anomalies that built this macro base.
Step 1: The Post-IPO Distribution Cycle (July 2021 – September 2022)
Recursion (RXRX) entered the public markets in April 2021 and embarked on a classic, aggressive IPO pump-and-dump cycle. After hitting a record high of $42.81 in July 2021, the speculative air was completely sucked out of the stock. RXRX then entered a structural freefall, sliding uninterrupted for nearly a year until it finally hammered out a capitulation base in the $4.00 to $4.13 region in May 2022.
Following this initial flush, a swift relief rally in September 2022 printed a prominent shooting star candle which topped out at $14.18. This single candlestick structural failure was highly significant: it drew the absolute line in the sand, establishing the rigid macro resistance ceiling that would cap every breakout attempt for the next four years.
Step 2: The July 2023 “Icy Hill” Anomaly
As the stock ground through mid-2023, it retested the $4 support floor and began to climb. For many retail technical analysts looking strictly at a price chart without volume context, the large green candle of July 2023 looked like proof that the sideways accumulation had run its course and RXRX was ready to break out and begin a bull run higher.
However, if we zoom into this specific period of price action, we discover a severe VPA anomaly. On a modern chart, these historical volume bars look compressed and flattened because they are visually overshadowed by the massive volume surges of late 2025 and 2026. This highlights a fundamental tenet of VPA: Volume must always be evaluated relative to its immediate historical context.
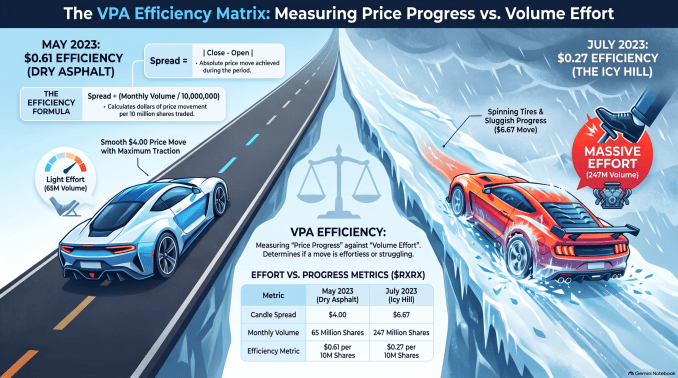
To expose the true nature of the July 2023 surge, we can use a new concept David and I are developing: the VPA Price Effort Efficiency Metric, which calculates the absolute dollar spread achieved for every 10 million shares of volume effort.
The mathematical reality is as follows:
May 2023 (The Baseline): The stock opened at $4.77 and closed at $8.77, yielding an absolute $4.00 price spread on 65 million shares of volume.
July 2023 (The Anomaly): The stock opened at $7.45 and closed at $14.12, yielding a $6.67 price spread. However, this move required a staggering 247 million shares of volume effort.
The Verdict: Driving on Ice
The mathematical contrast is stark. In July 2023, the market poured nearly 400% more volume effort into the stock, yet its structural price efficiency plummeted by more than half (from $0.61 down to $0.27).
As mentioned in my book ‘The Complete Guide to Volume Price Analysis ’, this is the exact market equivalent of a driver slamming their foot to the floor on an icy hill. The engine roars, the tyres spin furiously at 247 million shares of effort, but the vehicle makes little upward progress because it hits an invisible wall of resistance.
A review of the corporate archives reveals exactly why this anomaly occurred. On July 12, 2023, mega-cap tech giant Nvidia (NVDA) announced a highly publicised $50 million strategic partnership with Recursion to accelerate their AI-driven drug discovery models.
This headline sparked absolute FOMO (Fear of Missing Out) across the retail trading community, creating a massive wave of public market buy orders.
Institutional market makers, early venture capital insiders, and trapped IPO bag holders recognized this massive influx of retail demand as a golden opportunity. They used the deep public liquidity pool to aggressively unload millions of legacy shares directly into the buying frenzy.
By dumping supply over the counter, they capped the asset’s upward progress, absorbing public capital and stalling the rally right at the pre-established $14.12 resistance ceiling.
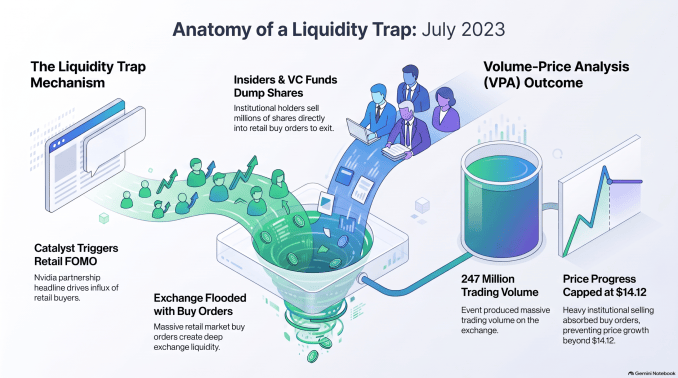
VPA RESULT: Massive Volume (247M) but Capped Price Progress ($14.12 Top)
Step 3: Multi-Year Ceiling Tests & Overlaid Patterns (2023–2025)
The aftermath of the July 2023 anomaly set the tone for the entire accumulation base. Over the next two years, RXRX tested the $14 macro resistance zone four times, printing a complex multi-top structure inside its rectangle base while consistently refusing to break beneath the $4 support floor.
To train your eye to see institutional footprints, you must look past individual monthly sessions and study overlaid candlestick patterns: For example,
If you visually merge the July and August 2023 monthly candles, they combine into a single macro shooting star candlestick.
If you merge the February and March 2024 monthly candles, they print an identical macro shooting star, signalling rejection at the ceiling.
In February 2025, another outsized volume anomaly occurred where price remained entirely trapped and compressed inside the box.
Throughout this multi-year period, market makers systematically ground through the float, maintained tight price controls, and slowly absorbed remaining supply from exhausted retail hands.
Step 4: The October 2025 Liquidity Washout (The Billion-Share Blast) (See the alternative to this section below)
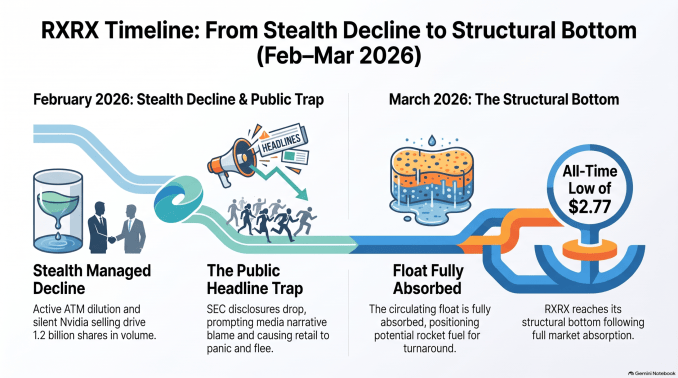
The culmination of this multi-year accumulation process arrived with the infamous candle of October 2025. The stock printed an astronomical, historic volume bar, tracking over 1.2 billion shares traded in a single month, leaving behind a heavy upper-wick candle closing right at the macro structural floor.
At the time, the true nature of this massive Wyckoffian effort was hidden. With hindsight, we now know the massive, record-breaking trading volume spike for Recursion Pharmaceuticals (RXRX) during October 2025 was a combination of two major factors: aggressive At-The-Market (ATM) share issuance and high-impact scientific milestones. However, the media only focused on the milestones, framing them as proof that the company’s “TechBio” approach could systematically map complex neurological diseases. This positive media coverage fueled the immense retail and institutional trading frenzy. However, it was not until early November, when the Q3 financial results were released, that the hard financial truths came to light.
The Angle: Financial journalists and retail trading forums finally connected the dots on why trading volume had been so astronomical in October.
The Reaction: Major market outlets shifted their focus away from the scientific breakthroughs to emphasize the heavy capital dilution. Headlines highlighted how Recursion had rapidly liquidated its entire old ATM facility to raise $387.5 million.
October built the hype, but it wasn’t until November that the financial press realized the massive volume surge was management successfully executing one of the biggest biotech capital-runway extensions of the year.
November also saw RXRX break the $4.90 structural floor, not only because of the dilution realization but also because of a catastrophic revenue miss, an abrupt C-suite shake-up, and broader institutional exit pressure.
These three compounding factors exposed on that exact day:
The Severe Revenue Miss
While the market knew Recursion was a high-burn biotech company, Wall Street was expecting Q3 revenues of roughly $16.95 million. Instead, Recursion reported just $5.18 million—marking an 80.2% year-over-year decline. This staggering miss deeply worried investors about the speed of commercialisation for its AI platform, completely overshadowing the $30 million Roche (RHHBY)/Genentech milestone.
Sudden C-Suite Shakeup
At the same time as the earnings release, Recursion announced a major leadership change. Co-founder Chris Gibson stepped down as President to become Chair of the Board, and Dr Najat Khan was appointed President. Market reaction to such unexpected news, along with the bad financial data, almost always results in heavy institutional selling.
The Dilution Hangover & Institutional Exits
Confirmation that management had also aggressively sold 25.3 million shares via the At-The-Market (ATM) facility signalled that management valued a cash safety net over protecting shareholders from dilution. Furthermore, the February 2026 13F filings later revealed that major tech investors such as Nvidia dumped their 7.71 million-share stake around this period, removing a major psychological floor for institutional buyers.
So, from a Volume Price Analysis (VPA) standpoint, attributing a 1.2-billion-share monthly volume anchor and a multi-month markdown to a 7.7-million-share sale is a severe mathematical error. Nvidia’s entire position represented less than 0.6% of that historic October volume effort.
This massive volume footprint was a masterclass in institutional managed decline, perfectly executed within full compliance of SEC regulations. While the prospectus supplement (Form 424B5) was officially issued and filed in October 2025, the At-The-Market (ATM) facility grants a company the legal right to quietly drip newly minted equity into the open market without real-time daily disclosure.
Because these transactions are only quantified retroactively in the quarterly 10-Q filing the financial media and the public remained completely blind to the dilution as it was happening. Market makers utilised this unannounced, rolling wall of supply to cap every rally, maintaining tight control over the price action to facilitate a massive, stealthy hand-off of the float directly into strong institutional hands.
While the company diluted its equity and Nvidia quietly exited under the radar, Cathie Wood’s ARK Invest and major market makers stepped directly into the teeth of the corporate supply flush. ARK aggressively absorbed the newly expanded float through to December 2025 and later acted as the structural buyer of last resort on the exact day of the February 13F panic—snapping up 1,251,270 shares in a single session to catch the falling knife. By systematically vacuuming up the structural dilution, these institutions permanently absorbed the float and established a rock-solid, definitive market bottom.
This is the backstory, and to bring it up to date:
The Breakout Trap, Options Sweeps, and the Short Squeeze Core on $RXRX
The Micro Framework: The Flawed Reclaim of the $4.90 Floor
Earlier this week, we have been given a live demonstration of Wyckoffian disharmony playing out right at a critical make-or-break pivot level. As seen on the daily chart, the battle line has officially shifted from the minor $4.14 level to the original, historic $4.90 structural floor.
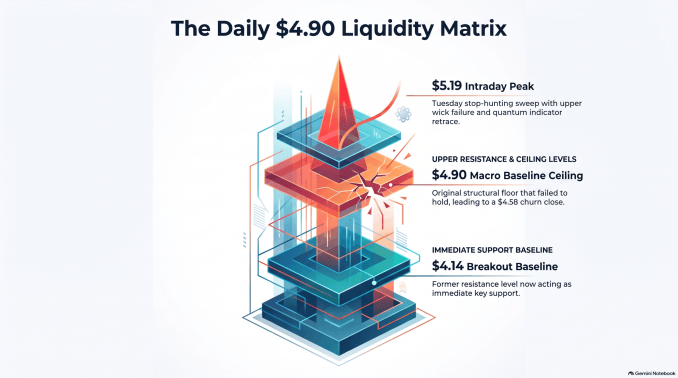
Monday’s False Promise: The week opened with an aggressive, promising surge. Shares exploded roughly 16% on high, expanding volume (67.28M shares), seemingly confirming the momentum required to pierce the macro resistance box. However, this rapid vertical expansion triggered our Quantum Volatility Indicator, signalling that the move was structurally overextended and highly susceptible to an immediate retrace into the candle’s spread.
Tuesday’s Whipsaw & Trap: The retrace arrived with mechanical precision on Tuesday. The session then devolved into a chaotic whipsaw trading range, pushing to an intraday high of $5.19 before reversing sharply to close well below the key horizontal level at $4.58. Tuesday’s candle left behind long wicks on both the top and bottom on heavy volume (66.5M shares).
From a strict Volume Price Analysis (VPA) standpoint, spending 66.5 million shares of volume effort only to yield an artificial, lower-closing narrow candle spread is the ultimate confirmation of institutional supply dumping. The market makers successfully checked the immediate breakout attempt, preventing a clean hold above the $4.90 level.
Unmasking the “Why”: The Hidden Corporate and Options Plumbing
While the VPA chart explicitly tracks what occurred, a forensic interrogation of alternative data feeds reveals the structural reasons why it unfolded this way over the past 48 hours:
The Fundamental Catalyst: The Tempus AI (TEM) Partnership Extension
The structural fuel behind Monday’s volume surge was a concrete fundamental headline. Recursion finalized an extended partnership agreement with Tempus AI running through to November 2029. This deal structures $42 million in guaranteed, non-dilutive license payments over the next three years, permanently altering the near-term cash metrics and validating the computational value of Recursion’s foundation models.
The Retail Call Option Trap & Gamma Churn
The Tempus AI announcement ignited a frenzy in the options market, driving total contract volume up by over 253% of its daily average. Speculative market participants aggressively loaded into short-dated, out-of-the-money $5.00 and $6.00 strike Call options.
This call-buying frenzy forces a unique mechanical reaction from option dealers. To hedge the sudden influx of short-call exposure, they are forced to buy the underlying stock, accelerating Monday’s explosive run-up. However, the moment the price ticked to $5.19 on Tuesday, market makers executed a swift liquidity sweep—triggering trailing stops, crushing the implied volatility (IV) on those retail options, and shorting the stock back beneath the $4.90 floor to collect premium. Once again, retail provided the required liquidity to fund institutional execution.
Cathie Wood’s Constant Bid
While retail chased short-dated options, Cathie Wood’s ARK Invest continued its massive, systematic accumulation strategy. Daily trade disclosures confirm that on Monday, October 5th, ARK loaded an additional 1,482,357 shares of RXRX across its flagship ARKK and ARKG exchange-traded funds, pouring over $6.1 million into the equity floor. Her consistent buying acts as a rigid institutional firewall, absorbing localised dumps and keeping the structural floor firmly intact.
The X-Factor: A 33.5% Short Float Ready to Explode
The most vital metric to observe alongside this temporary technical rejection is the extreme, crowded nature of the bearish trade. Short interest in $RXRX has scaled massively, tracking at 178.72 million shares sold short, which represents a staggering 33.5% to 35.8% of the entire publicly tradable float.
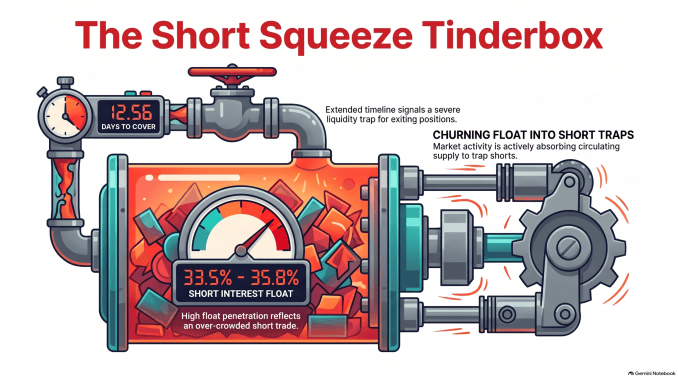
Short Interest Float Penetration: 33.5% – 35.8% (Highly Crowded) [1.3.2, 1.3.3]
Days to Cover Ratio: 12.56 Days (Severe Liquidity Trap) [1.3.2]
Current Technical State: Churning float directly into Short Traps
With a Days to Cover ratio of 12.56 days, short sellers are trapped in an incredibly illiquid position. It will take over two full weeks of average aggregate market volume for these funds to exit their positions if a true squeeze materializes.
The Forensic Conclusion: Tuesday’s high-volume whipsaw candle is not a death sentence for the stock; it is an active liquidity compilation phase. Market makers are intentionally keeping the price pinned underneath $4.90 to churn the float, clean out weak retail hands, and allow institutions such as ARK to build a larger position. However, with over a third of the float short and non-dilutive Tempus cash now backing the balance sheet, any sustained high-volume daily close that cleanly breaks and holds above the $4.90/$5.19 zone will trigger a historic, structural short squeeze toward our primary $7.00 macro confluence target.
Since writing this analysis, RXRX is still trading within the spread of Monday’s volatility candle. The high and low of this candle now provide key intraday levels to watch. The high is $4.93, and the low is $4.06.
Finally, if you are tracking Recursion, November is an important month, and make sure you have the following dates marked on your calendar.
Q3 2026 Earnings Release: Estimated for November 4, 2026, before the market opens.
Clinical Trial Data Catalyst: Phase 2 clinical readout for their primary oncology candidate, REC-4881, is expected to be released in November 2026
If there is one key VPA lesson from this analysis, it is that successful breakout trading is possible, despite the bad press it sometimes gets, but only if traders and investors apply volume price analysis. Understanding the significance of anomalies at key support and resistance levels will protect traders and investors from becoming institutional liquidity. With a stock such as Recursion (RXRX), the deeper the float, the more effort and volume a successful breakout will require.
Summary:
The Myth: Retail panicked in February 2026 because they believed Nvidia’s exit killed the stock’s fundamental story.
The Reality: The markdown to the $2.80 ATL was an institutional liquidity hand-off. Market makers used the ATM dilution and the Nvidia headline panic to drive the price to a deep discount, allowing major funds like Cathie Wood’s ARK Invest to step in as the buyer of last resort and permanently vacuum up the newly expanded float.
The Conclusion: The Unique Biotech Mandate
As traders, we must balance the technical and fundamental pictures.
The exact percentage you lean on either discipline depends entirely on your holding period (scalpers lean technical; position traders lean fundamental), although I have yet to meet a scalping trader who isn’t aware of key fundamental data and news and trades during volatility. Or a position trader who doesn’t consider chart structure. In other words, it’s a question of how much notice to take of either discipline at any given time.
However, regardless of whether you are a scalping trader, swing trader, or investor, biotech stocks are unique and highly sensitive. You can’t trade them purely off a chart. They demand awareness and research into the corporate plumbing, institutional hand-offs, and clinical timelines because a single regulatory filing or trial readout can rewrite the entire chart structure in an instant.
Finally, if you are tracking Recursion, November is an important month, so make sure you have the following dates marked on your calendar.
Q3 2026 Earnings Release: Estimated for November 4, 2026, before the market opens.
Clinical Trial Data Catalyst: Phase 2 clinical readout for their primary oncology candidate, REC-4881, is expected to release in November 2026



Comments
Log in or sign up to join the conversation.