✨ Takeaways
• The initial gold selloff was a logical response to stronger-than-expected payrolls, higher Treasury yields, and a stronger dollar.
• The character of the market changed dramatically once gold broke below the 200-day moving average and the $4400 psychological level.
• Technical selling, stop losses, retail long liquidation, and systematic flows likely played a larger role than fundamentals during the second phase of the decline.
• Simultaneous weakness across gold, equities, semiconductors, crypto, and other precious metals points toward liquidity-driven positioning adjustments rather than a simple gold-specific story.
• Falling ETF holdings and declining open interest suggest the market had already been struggling to attract fresh buyers before the payroll shock arrived.
• The long-term structural case for gold remains intact, but short-term price action is currently being driven by real yields, positioning, and liquidity conditions.
The first $60 belonged to economists. Everything below $4400 belonged to traders.
That may ultimately be the simplest way to explain what happened in gold last week.
Most investors looking at the chart will see a single violent move lower. Traders tend to see two completely different markets. The first decline made perfect sense. The second is where the story becomes far more interesting.
Gold spent much of the week slowly losing altitude as the market digested a steady drumbeat of stronger economic data. JOLTS surprised to the upside. ADP reinforced the message. Treasury yields pushed higher. The dollar strengthened. By the time Friday’s payroll report arrived, the mountain was already carrying fresh snow. The market simply had not yet realized how unstable the slope had become.
Then the payroll report landed.
Nonfarm payrolls rose by 172,000, nearly double consensus expectations, and suddenly the entire rate narrative shifted. Treasury yields surged. The dollar caught a fresh bid. Gold immediately dropped roughly $60. At that point, there was nothing mysterious about the move. Stronger growth, higher yields, a hawkish Federal Reserve and lower gold is a relationship every macro trader understands. Economists could comfortably explain every tick of that decline.
The first $60 belonged to economists.
Everything that happened after belonged to market structure.
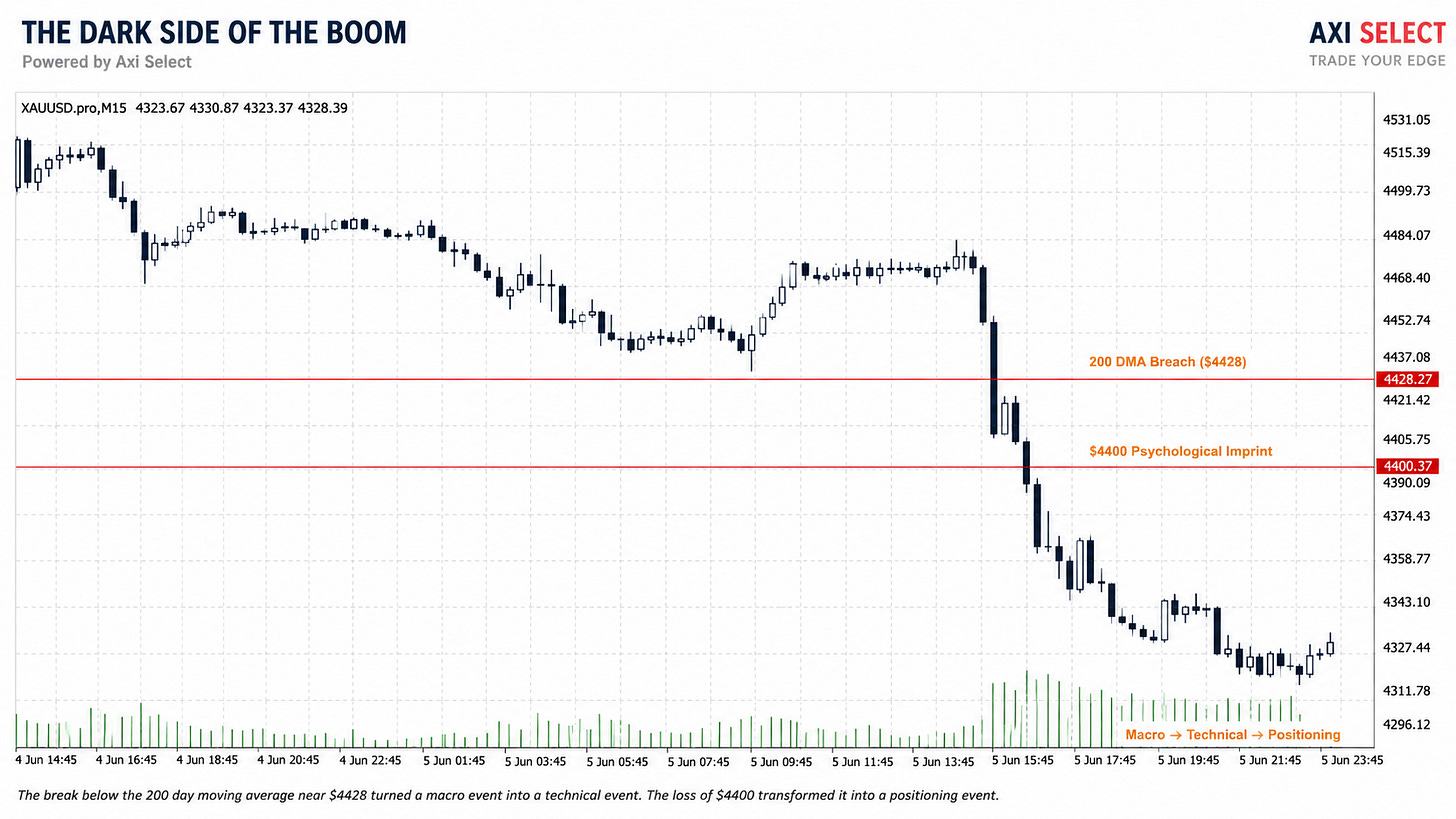
As gold approached the $4400 psychological level, the character of the tape changed. What had begun as a straightforward repricing of interest-rate expectations started to behave like an avalanche. The break below the 200-day moving average around $4428 removed an important layer of support. The move through $4400 removed a psychological imprint. Stop losses began triggering. Momentum systems joined the selling. Retail traders who had spent the past month growing comfortable on the long side as oil prices retreated suddenly found themselves running downhill with everyone else. The market stopped responding to economic news and began responding to itself.
That distinction is important because avalanches rarely begin where the damage occurs. The first crack appeared in the labour market. The payroll report merely widened it. Treasury yields became gravity. The AI trade added weight. Volatility increased momentum. Dealer hedging flows helped accelerate the slide. By the time the selling reached gold, the market was no longer debating employment data. It was searching for liquidity.
And that is where gold’s role changed.
For most of the past year, gold had been treated as one of the market’s safest possessions. Central banks were buying. Governments were borrowing. Geopolitical tensions were rising. Investors increasingly viewed bullion as protection against a world accumulating debt faster than solutions. The trade worked. Gold became profitable. Gold became liquid. Gold became widely owned.
Ironically, those strengths may have become vulnerabilities.
Markets under stress rarely sell the assets nobody wants. They sell the assets everybody wants. Gold had become one of the few places where investors could still convert conviction into cash. When losses begin appearing elsewhere in portfolios, the temptation to monetize winners becomes difficult to resist. Whether that pressure came from systematic funds, discretionary managers, retail traders, or even investors nursing wounds in the AI complex is impossible to prove with precision. But the timing is difficult to ignore. The same session that saw gold fall through key support also witnessed significant pressure across semiconductors, momentum trades, and parts of the broader technology complex. Gold may not have been sold because investors stopped believing in gold. Gold may have been sold because it remained one of the few assets they could still sell at a profit.
The evidence from the futures market adds another wrinkle. Open interest had already been falling for months. ETF flows had softened. Trading volumes were hardly screaming enthusiasm. In other words, the mountain was not overloaded with new buyers. It was slowly running out of them. Gold had spent weeks searching for the next wave of demand, only to find fewer willing participants than many had assumed. When the technical floor finally gave way, the market discovered something uncomfortable. There were simply not enough buyers standing in the valley to absorb the slide.
This is also where the options market may have quietly poured fuel onto the fire. Spot gamma is often discussed in abstract terms, but the concept is straightforward. As markets break important levels, dealer hedging flows can shift from absorbing volatility to amplifying it. Prices move. Hedges adjust. Those adjustments create additional price movement. The process becomes self-reinforcing. What began as a payroll-driven repricing gradually evolves into a feedback loop driven by positioning, liquidity, and market mechanics.
Yet beneath all the noise, a second battle continues. While speculative money has been heading downhill, central banks continue climbing in the opposite direction. ETF investors have been harvesting profits and reducing exposure. Reserve managers continue accumulating bullion. One group is trading the next payroll report. The other is positioning for the next decade. That tension remains unresolved and may ultimately determine whether this correction proves temporary or something more significant.
For now, my working theory remains relatively simple. The payroll report started the avalanche. Rising Treasury yields supplied gravity. The break below the 200-day moving average destabilized the slope. The move through $4400 set the boulders loose. Stop losses, systematic selling, dealer hedging flows, and perhaps some degree of liquidity raising from investors caught in the AI unwind accelerated the descent. By the time gold reached its lows, the market was no longer trading economics.
It was trading liquidity.
And when markets start trading liquidity, even the strongest assets can find themselves caught in the slide.
Needless to say, if you've been reading this blog for any length of time, you'll know I've been a long-standing believer in the gold and currency debasement trade, and nothing that happened last week changes that view. I continue to believe that gold has a credible path toward $ 8,000 in the years ahead. Even if some of this year's month-end physical purchases are currently underwater, the bulk of my physical holdings accumulated since 2022 remain comfortably hedged and continue to reflect a long-term strategic allocation rather than a short-term trading position.
Theoretical 2026 Physical Market Purchases In Thai Bars
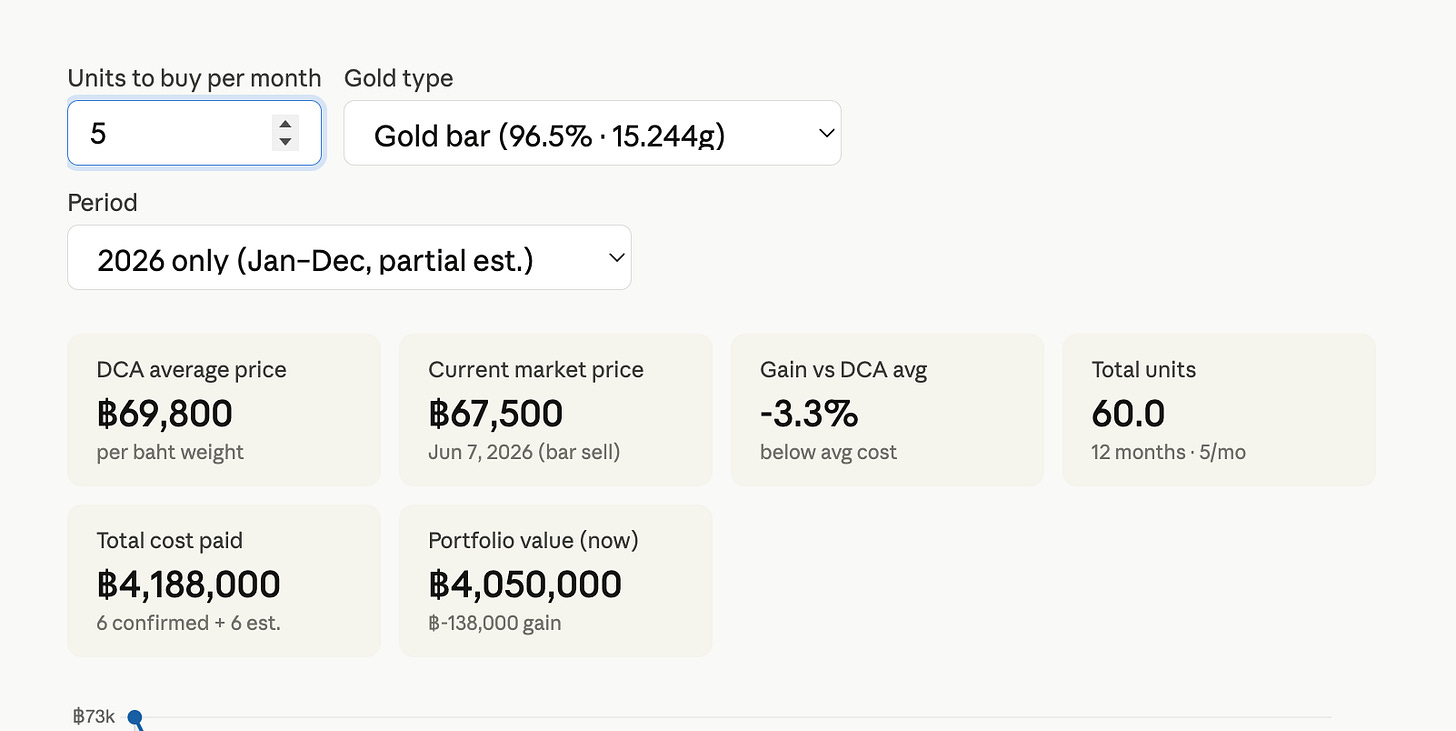
My downside hedge structure remains largely anchored around the $ 5,000 area, but the mathematics of that hedge is now changing. The lower gold moves from here, the sooner those downside protections begin to come off, and the greater my upside participation becomes if the bull market reasserts itself. In fact, I have already begun adjusting portions of that framework, moving parts of my upside participation zone from roughly $4850 toward $4725. While traders are understandably focused on the avalanche currently moving down the mountain, I remain focused on the summit above. Sometimes the strongest secular bull markets shake off the most passengers before the next climb begins.


Comments
Log in or sign up to join the conversation.