

The FOMC released the minutes from Chair Warsh’s first meeting on Wednesday, and the best word to describe the Fed’s advice is “ambiguous.” Merriam-Webster defines ambiguous as a state or, in this case, a statement that allows for more than one interpretation.
Officials entertained policy scenarios in both hawkish and dovish ways. Some see inflation easing enough to allow rate cuts, while others envision sustained price increases that would require rate hikes. Warsh billed the ambiguous internal debate as a “family fight” that ended with a unanimous vote to hold. The statement doesn’t paint the picture of a committee marching lockstep toward a hike later this year. It is a committee uncertain about what comes next. Might this become the norm as they attempt to dissuade forward guidance?
Regarding inflation, the meeting participants judged that inflation would:
Remain elevated in the near term and then begin to decline as the effects of tariffs and energy price increases wane and other supply disruptions related to the closure of the Strait of Hormuz diminish.
Importantly, the risks to the inflation outlook, they noted, were “still tilted to the upside.“
There was more ambiguity with the Feds outlook on AI-driven inflation and disinflation. The committee stated, “Ongoing strong demand for AI infrastructure would likely sustain upward pressure on prices for technology products and electricity.” The AI buildout is a source of inflationary pressure, at least in the near term. However, Warsh and some other Fed members have also discussed the disinflationary benefits of AI-related productivity gains.
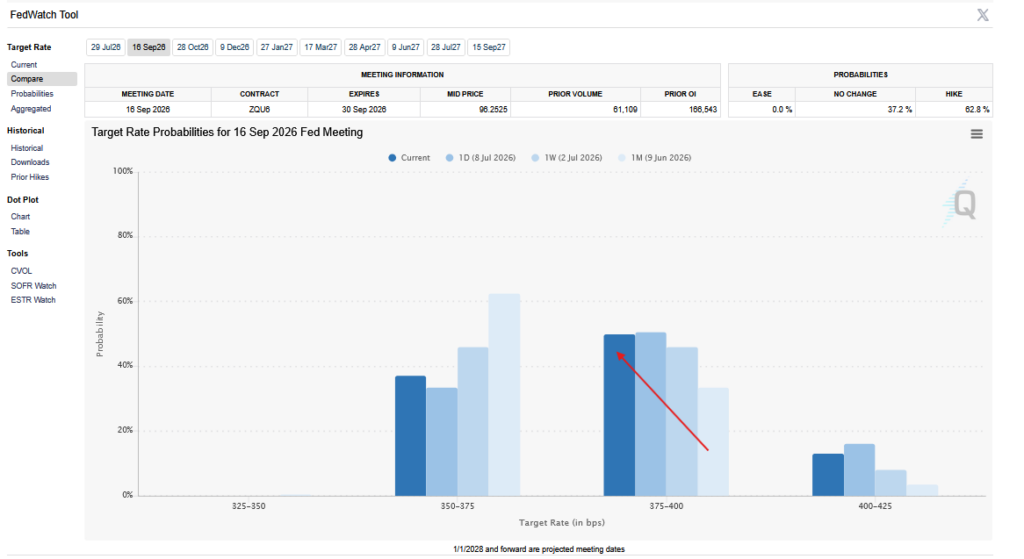
Given the ambiguous nature of the minutes, investors should watch the upcoming June CPI and PPI data, and then the July employment data, for policy clues. As we share below, the market assigns a 50% chance of a hike at the September meeting. Given the lack of visibility under Warsh, as we wrote in Forward Guidance R.I.P., the data will gain in importance and likely boost market volatility around key data releases.
What To Watch Today
Earnings

Economy
No notable economic releases
Market Trading Update
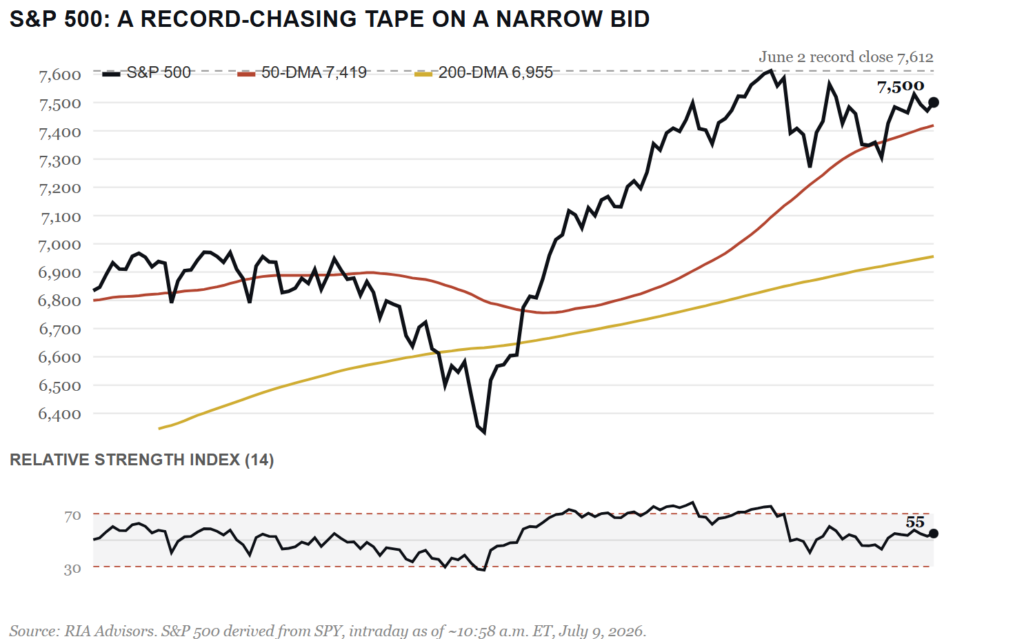
Yesterday, discussed that both Volatility and Realized Volatility were hiding some fierce undercurrents. Today, bring that question down to the tape and ask the simpler version: who is actually buying these stocks? The S&P 500 sits near 7,534 as I write, roughly 1.5% under the June 2 record high of 7,620, and someone has to be lifting the offer to keep it there.
Start with the price. The index is holding about 1% above its 50-day average near 7,419 and about 8% above a still-rising 200-day average near 6,955. The 14-day RSI reads in the mid-50s, neither overbought nor washed out. This tape looks fine on the surface. The question is what’s underneath it.
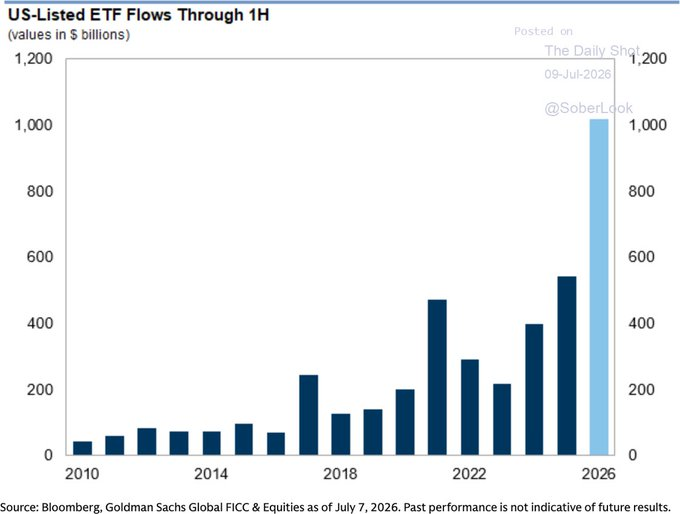
Run through the buyers one at a time, and the picture gets thinner. Retail set records in May and pressed higher in June. Passive and ETF flows have pulled in better than a trillion dollars this year, running about 45% ahead of last year’s record pace.
Scott Rubner at Citadel Securities, who sees roughly a third of US retail order flow, has laid out that mechanical bid in detail, and I don’t argue with his map. But the same map shows the pillars starting to wobble. CTAs are already near the top of their range with little room to add. Pension plans sitting around 110% funded don’t press their luck; they de-risk into strength. And corporate buybacks, the most reliable buyer of all, go quiet as Q2 earnings season opens and companies slip into their blackout windows.
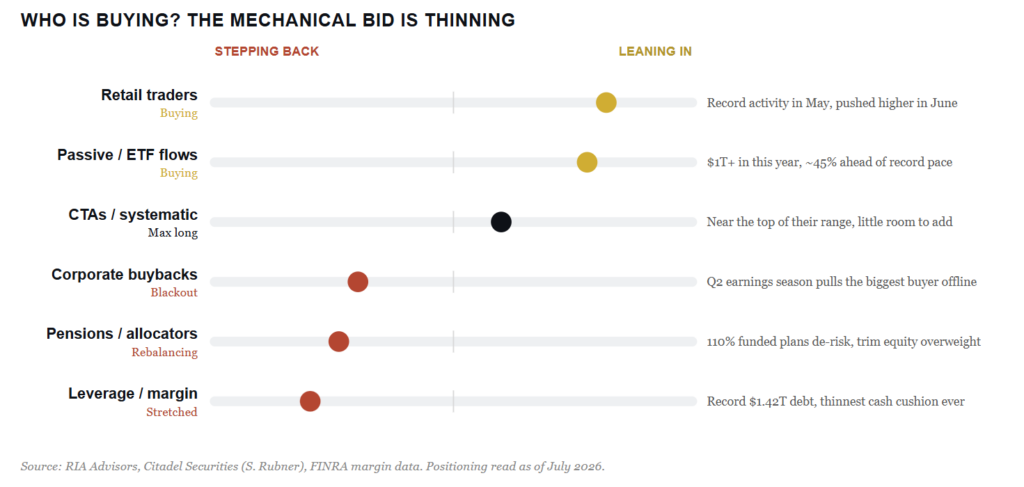
Notice in the chart above where the marginal buyer is fading. Over the past month, equal-weight (RSP) has actually edged past cap-weight, and small caps led again today. That’s a tentative broadening, and it’s welcome. But for the quarter, the cap-weighted index still beat the equal-weighted index by more than 2 points. The bid stays concentrated in a shrinking list of names.
Let me restate what we concluded yesterday, as it is appropriate still today.
None of this times a top. It does tell you the margin for error is thin. In our models, we’re holding equity at target weight rather than above it, keeping quality high, letting the cash buffer ride, and managing risk at our stops instead of chasing the tape. When the mechanical buyers step back, you want to be the one holding dry powder, not the one forced to sell.
One Rate Hike Rarely Means One Rate Hike
The ambiguity in Wednesday’s minutes is deliberate and may be masking something the market is not fully pricing in. While the Feds debate was split, history offers an important lesson: once the Fed starts hiking rates, it rarely stops at just one.
Former St. Louis Fed President Jim Bullard stated it plainly.
“The committee does not generally do that. What’s the point of one rate increase?
The Feds record supports his skepticism. Since 1990, the Fed has initiated five distinct tightening cycles. Not one ended after a single move.
1994: Seven hikes — Fed funds doubled from 3% to 6% in twelve months
1999: Four hikes over twelve months before the dot-com bust forced a reversal
2004: Seventeen consecutive hikes over two years from 1% to 5.25%
2015: Nine hikes spread over three years
2022: Eleven hikes, 525 basis points in sixteen months — the most aggressive cycle in forty years
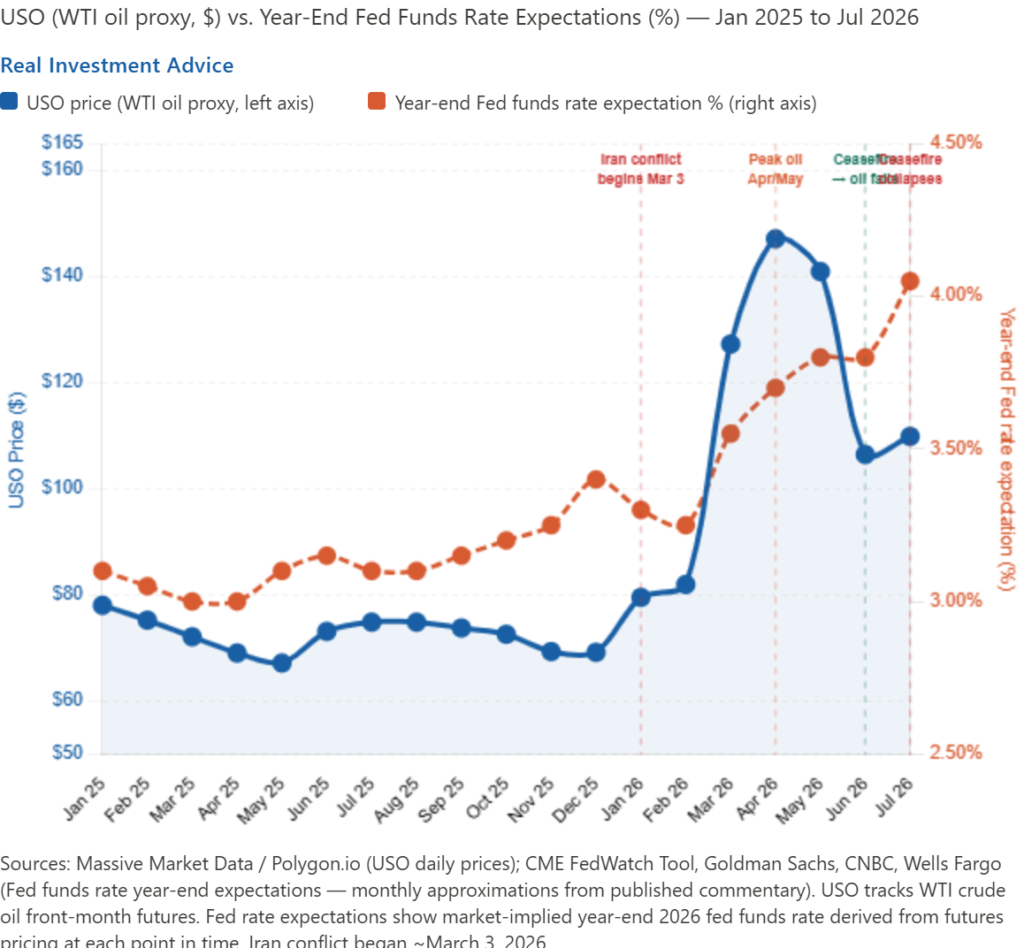
Today’s environment environemnt is a little unique as it’s a supply-driven inflationary concern. The Fed’s policies will have little influence on oil prices.
While the minutes were ambiguous, the historical playbook is not. If September brings the first hike, investors should be thinking about November and assessing whether the rate hike is temporary and a one-off move or the first in a series. If they hike, our bet is they hike once or twice and quickly reverse course once oil prices head lower again.
The graph below shows the correlation between oil prices and year-end Fed Funds expectations.
Tweet of the Day

Comments
Log in or sign up to join the conversation.