


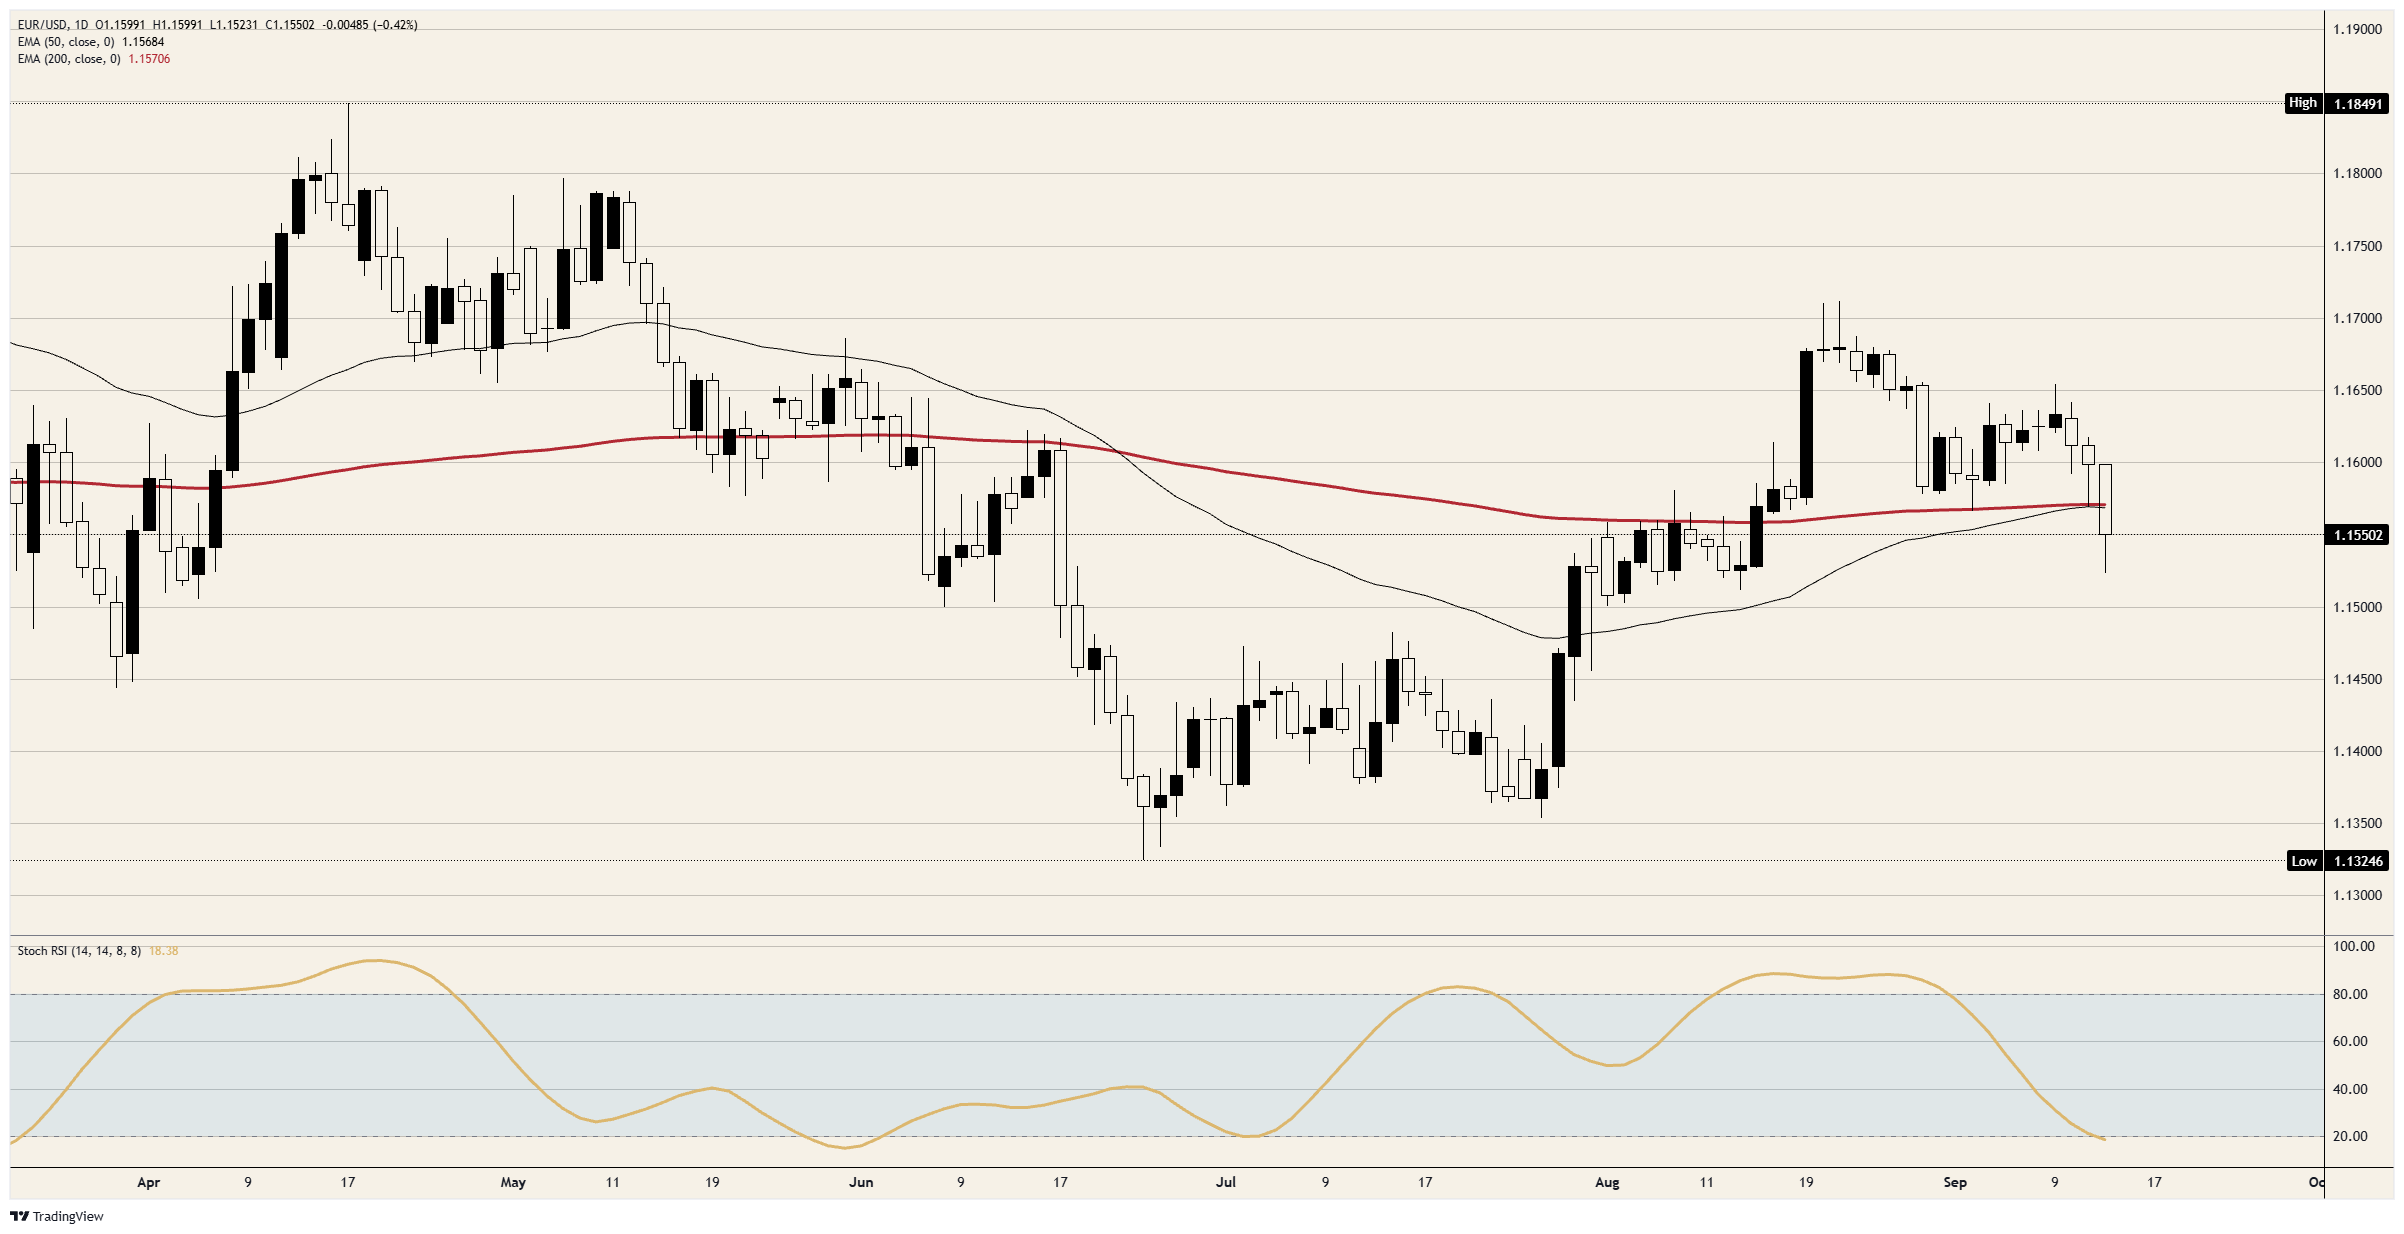
EUR/USD closed near 1.1550 on Monday, 0.42% lower, and beneath both of its moving averages for the first time since late July. The 50-day and 200-day Exponential Moving Averages (EMA), the chart's two usual reference lines, now sit two pips apart, so the pair fell through one line rather than two. The Dollar rose against every major currency on the day. Futures tied to the Fed's rate ended it with Wednesday's quarter-point increase priced at 100%, which would be the first American increase since 2023. The European Central Bank (ECB) raised its own rate last Thursday, and the Euro has fallen in every session since.
The forecast that justified the hike has a cheaper barrel in it
The ECB raised its deposit rate, the rate it pays banks on the cash they park with it overnight, to 2.50% on September 10. It was the second increase of the year, and the decision was unanimous. The statement said inflation will stay well above target for an extended period. The staff forecast published alongside has inflation peaking at 3.6% in the fourth quarter and back at 2.5% by the middle of next year. That path rests on a Crude Oil price assumption fixed on August 19: Brent averaging $88 a barrel this quarter and $78 next year. Brent has traded above $100 since the week the forecast came out, and above $105 on Monday.
For the Euro the assumption matters more than the hike. Europe imports nearly all of the Crude Oil it burns and pays for it in Dollars. Every $10 added to the barrel is Euros sold to buy the Dollars that settle the invoice, before any rate decision is made. The same forecast assumes the Euro at 1.16 against the Dollar through 2028. Monday's close was half a cent beneath it.
Both rate paths add the same three or four hikes
Futures tied to the Fed's rate put Wednesday's increase to 3.75% to 4.00% at 100%, with a second by December and a rate near 4.55% by next July. That is almost a full point above today's. The same futures put the ECB's next increase at 78% for October 29 and its deposit rate near 3.40% by next September, just under a point above today's. Both banks are priced for three or four increases, so the gap between what Dollars and Euros pay a year from now is the gap today, plus four hundredths.
The rate gap did not sell the Euro on Monday. The 10-year Treasury yield touched 5% for the first time since 2023, and Crude Oil spent the London morning at a four-month high. Both are prices paid in Dollars, and a Euro that has to buy Dollars for its fuel bill is sold on the days the Dollar is dear for other reasons too. The committee's own June forecast had the Fed's rate at 3.8% for the end of this year and 3.6% for next. The market has priced almost a full point more for 2027 than the committee wrote down three months ago. Wednesday's new projections are where the two versions meet, and only one of them can move the Dollar.
An ECB president at 17:00 GMT and a Fed decision at 18:00
Tuesday brings the ZEW survey of financial analysts at 09:00 GMT, forecast at 39.9 after 31.4, and an ECB board member's speech at 14:00. Wednesday opens with Eurozone industrial production at 09:00 GMT, forecast down 0.4% in July after a flat June. American retail sales follow at 12:30 GMT, forecast up 0.9% in August after a 0.6% fall. Retail sales are counted in dollars, and August's gasoline cost more than July's, so the headline will flatter. The control group, which strips out fuel, cars and building materials, is the number the Fed reads before it votes five and a half hours later.
The ECB president speaks at 17:00 GMT on Wednesday, the Fed announces at 18:00 and its chair follows at 18:30. Thursday brings the ECB's chief economist at 07:00 GMT and the final August inflation reading at 09:00, forecast unchanged at 2.4% on the core measure. The ECB's rate increase from last week takes effect on Wednesday, September 16, the day the Fed votes on its own.
The map into Wednesday
Resistance: The two averages near 1.1570 are the cap, two pips apart and the line the pair closed beneath on Monday. Above them, 1.1600 is the level the pair traded around for two weeks and closed beneath on Friday, and the September high short of 1.1650 sits behind it.
Support: Monday's low just above 1.1500 is the first mark, with the early-August base at 1.1500 beneath it. Under that, 1.1450 is the next level the case reaches.
Bias: Lower while 1.1600 caps, with 1.1500 the first objective and 1.1450 the second. Monday's close beneath both averages is the first since late July, and the daily Stochastic Relative Strength Index (Stoch RSI), a momentum gauge, sits near 18 and is still falling. The move is stretched rather than finished. Invalidation is a daily close back above 1.1600, which puts the pair back on top of both averages.
EUR/USD daily chart

Comments
Log in or sign up to join the conversation.