
Here’s a picture of several key macro indicators followed by the NBER BCDC, including today’s employment release and monthly GDP, and yesterday’s consumption and mfg/trade industry sales numbers. The recovery continues.
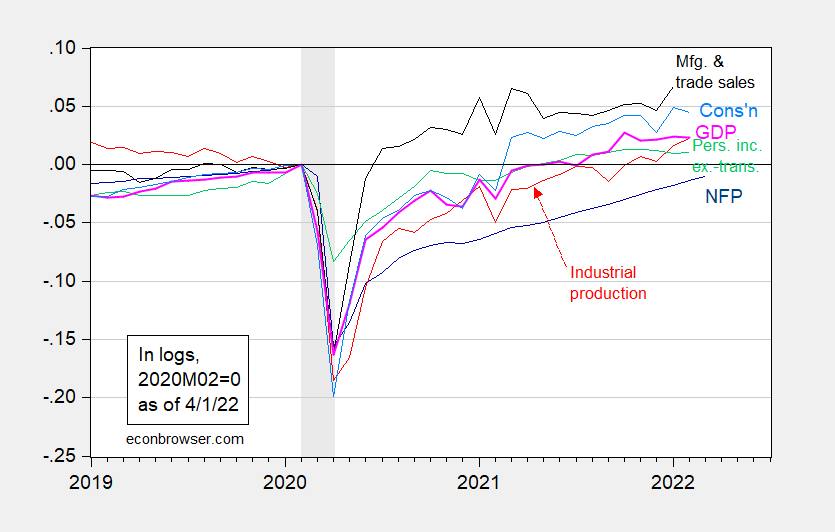
Figure 1: Nonfarm payroll employment (dark blue), Bloomberg consensus for February NFP (blue +), industrial production (red), personal income excluding transfers in Ch.2012$ (green), manufacturing and trade sales in Ch.2012$ (black), consumption in Ch.2012$ (light blue), and monthly GDP in Ch.2012$ (pink), all log normalized to 2020M02=0. NBER defined recession dates, peak-to-trough, shaded gray. Source: BLS, Federal Reserve, BEA, via FRED, IHS Markit (nee Macroeconomic Advisers) (4/1/2022 release), NBER, and author’s calculations.
The employment numbers were slightly under Bloomberg consensus (431K vs 490K), but the previous months’ numbers were revised upward.
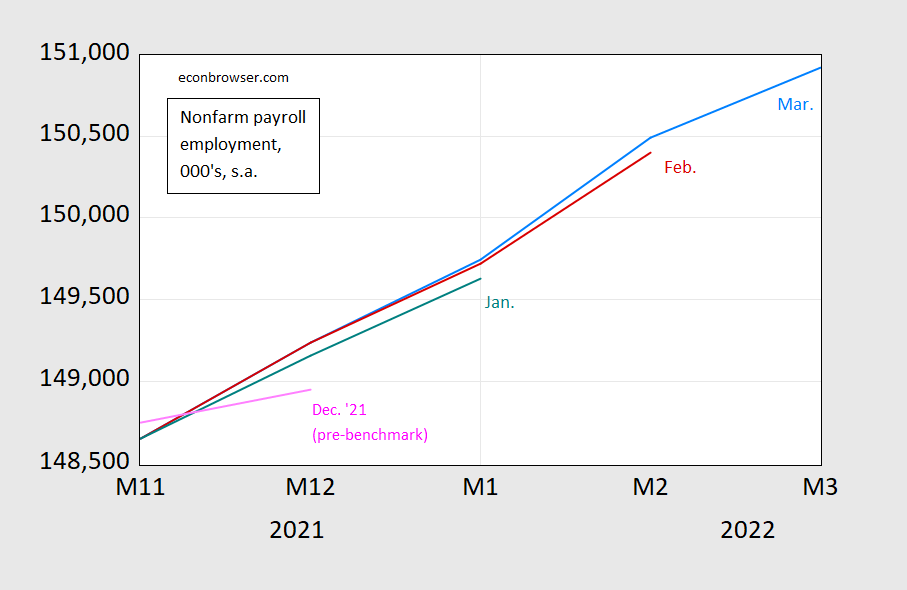
Figure 2: Nonfarm payroll employment from March release (light blue), February (red), January (red), Dec. ’21 (pink), all in ‘000’s, s.a., seasonally adjusted, on log scale. Source: BLS via FRED, various vintages.
Confidence that employment is continuing to increase is reinforced by the upward movement in alternative measures.
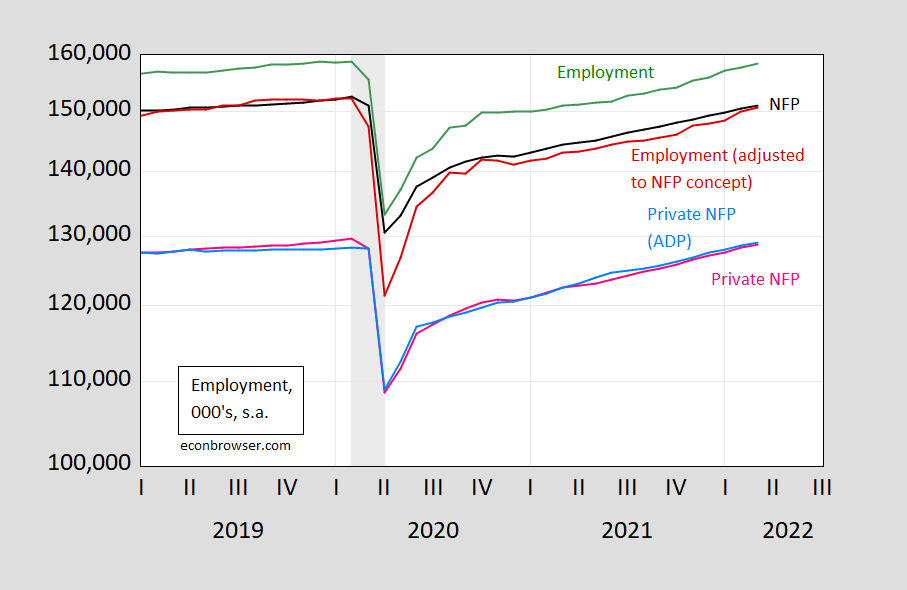
Figure 3: Nonfarm payroll (NFP) employment (black), civilian employment (green), civilian employment adjusted to NFP concept (red), private NFP (pink), and private NFP from ADP (light blue), all in 000’s, s.a., on log scale. NBER defined recession dates peak-to-trough shaded gray. Source: BLS via FRED, BLS, ADP via FRED, and NBER.
While employment continues to rise, some sectors continue to lag pre-peak levels. From CEA today:
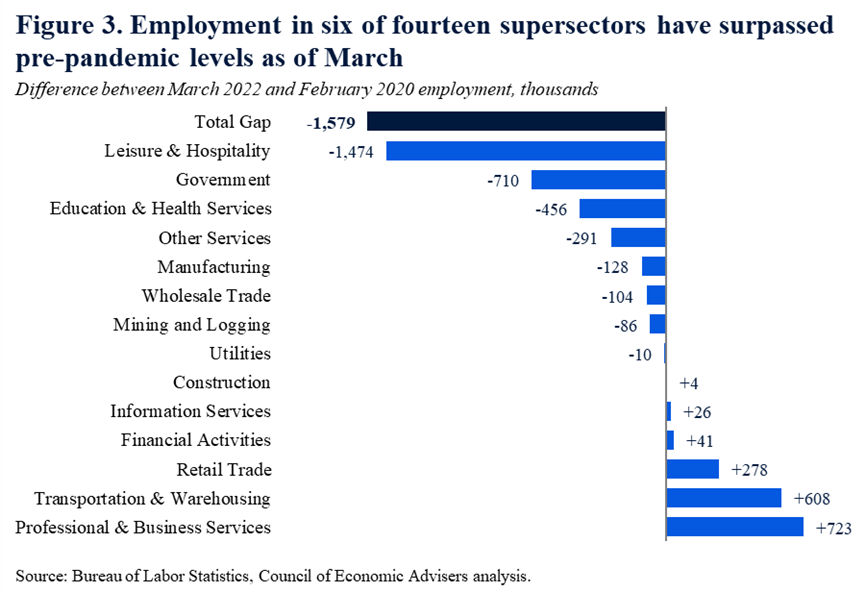
Source: CEA, April 1, 2022.
Leisure and hospitality employment is 1.6 million jobs below NBER peak levels.
That being said, nowcasts for 2022Q1 indicate subdued growth: GDPNow is 1.5%, while IHS MarkIt tracking indicates 0.2% (both 4/1).


Comments
Log in or sign up to join the conversation.