

All the major indexes are reaching up to new highs despite some early warning signs about potential weakness in the economy. It seems as though we have entered the speculative stage of an already highly valued stock market. The catalyst is probably the prospects of a tax cut.
This chart indicates that economic growth will probably weaken in the months ahead. However, it is possible that confidence in a future tax cut could help the ECRI bottom out and turn higher. For now, I think it is better to follow the market rather than the indicators.
(Click on image to enlarge)

You have probably seen this chart. It gets posted frequently on stockcharts.com. This certainly adds to the view that stocks are highly priced.
(Click on image to enlarge)

The Transports broke out this week and have re-affirmed the bull market trend.
(Click on image to enlarge)

The S&P1500 and the NYSE breadth look solidly bullish.
(Click on image to enlarge)

Small Caps showed their overwhelming approval this week of the potential tax cut. Very bullish.
(Click on image to enlarge)

The Weekly Leaders List
Below is a weekly, long-term list of leaders. There are no short-term indicators considered in these rankings. ETFs in blue have the best scores. Disclaimer: This is not a recommendation to buy or sell.
I am thinking about completely separating the short-term and long-term leaders list. I really want to trade less, and increase my holding period for ETFs. I think this list will help.

The Regional Banks aren't on the long-term leader list, but they may be soon.
(Click on image to enlarge)

Mid Caps look very bullish also.
(Click on image to enlarge)

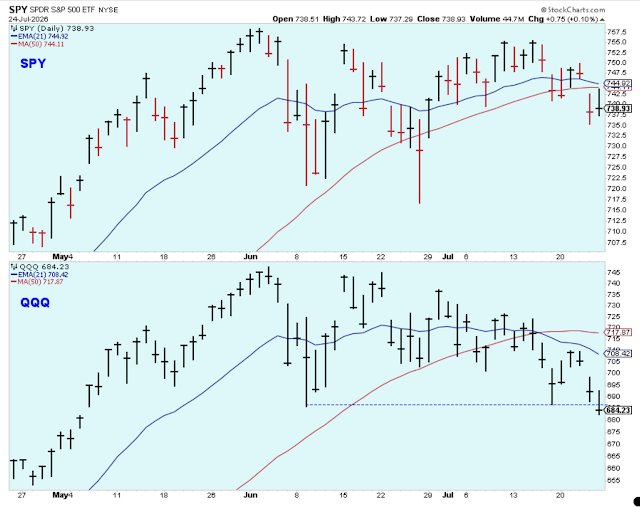
The QQQ looks close to a nice upside break.
(Click on image to enlarge)

Summary
The ECRI index is pointing to weak economic growth in the months ahead, but the stock market is acting very bullish.
The long-term outlook is worrisome.
The medium-term trend is up.
The short-term trend is up.


Comments
Log in or sign up to join the conversation.