

The recent streak of 20%+ annual gains has renewed debate around what investors should realistically expect from the S&P 500. Historically, the index most commonly delivers annual returns in the 10–20% range, with 34 years falling within that band since records began. Market declines, however, are far from rare. The S&P 500 has experienced returns between -10% and -20% in 18 different years, declines between -20% and -30% seven times, and a drop greater than -40% only once, during the 1931 Great Depression. While the stock market has historically trended higher over the long term, volatility and downturns are a normal part of investing. In fact, more than one-third of all calendar years have produced negative returns.
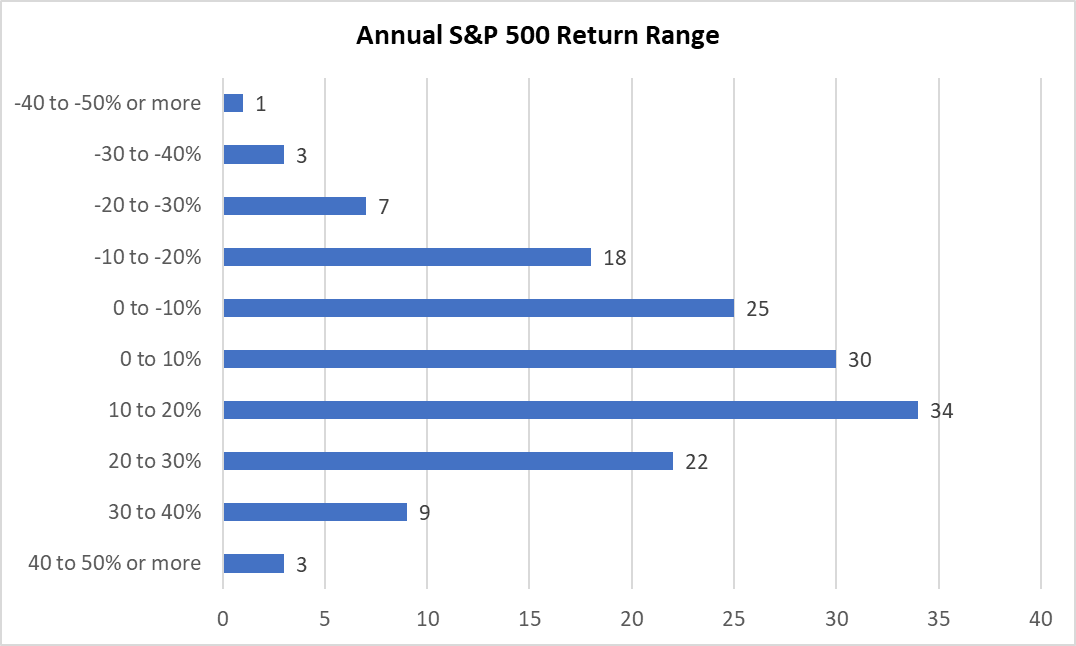
This graph was produced by Lucas Juery, CFA, CFPⓇ and is not intended to provide financial advice.


Comments
Log in or sign up to join the conversation.