
From Donald J. Trump, March 14, 2016:
…under decades of failed leadership, the United States has gone from being the globe’s manufacturing powerhouse — the envy of the world — through a rapid deindustrialization…
Here is a graph of real value added in manufacturing and manufacturing employment, 1967-2015.
(Click on image to enlarge)
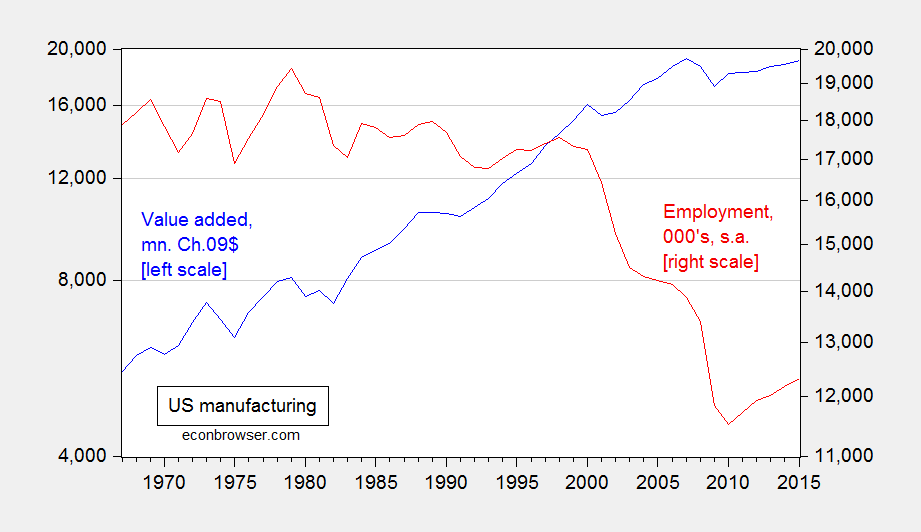
Figure 1: Real value added in manufacturing (blue, left log scale), and manufacturing employment (red, right log scale). Source: BEA and BLS via FRED.
Note that 2015 real value added in manufacturing essentially matches that recorded in 2007, even while employment is 11% lower. That, mechanically, is the outcome of high productivity growth in that sector.
One way which manufacturing employment can be increased is by decreasing productivity levels. That in turn, can be accomplished by stifling trade in intermediate goods which is associated with production fragmentation/development of global value chains. And that can happen with relatively small increases in tariff rates…Needless to say, higher employment accomplished in this manner need not be welfare-increasing.
Of course, if overall manufacturing output declines due to foreign country retaliation against the imposition of tariffs, then employment still might decline.


Comments
Log in or sign up to join the conversation.