


Most investors learn early on that time in the market beats timing the market, and this graph is a powerful illustration of why. From 2006 through 2025, staying fully invested in the S&P 500 would have generated an annualized return of roughly 11%. Miss just the 10 best days, and that return falls to 6.6%. Miss the 40 best days, and the return turns negative. Market history tells us to stay disciplined, keep enough cash set aside for near-term expenses, and avoid letting short-term market volatility derail your long-term investment plan.
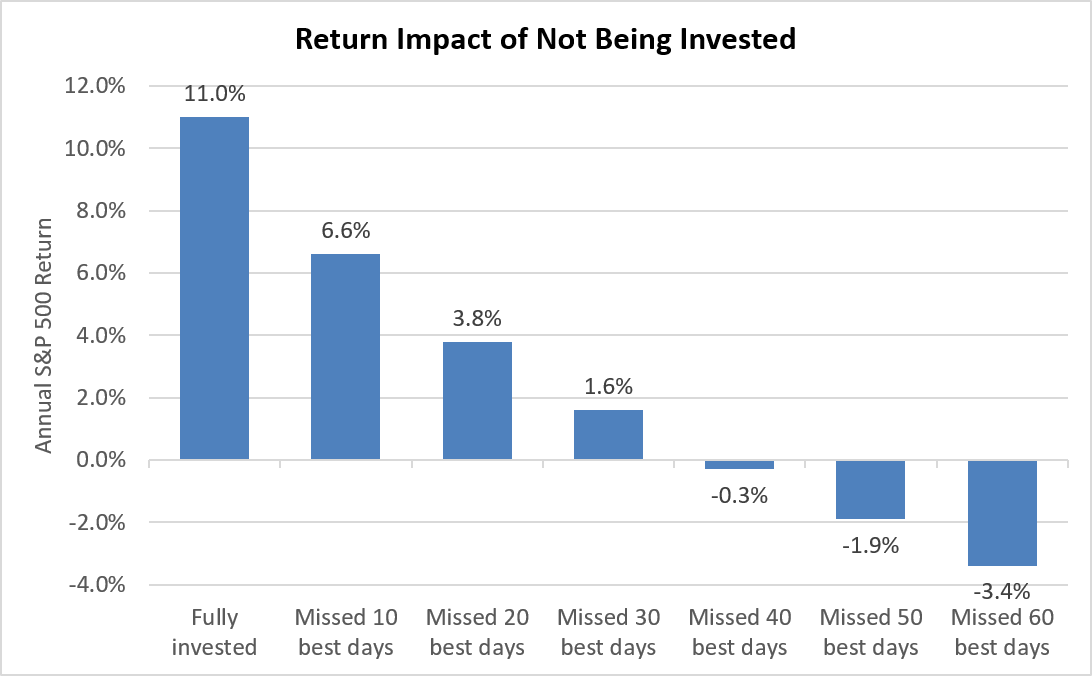
Source: Guide to the Markets; 2006-2025 S&P 500 returns
This graph was produced by Lucas Juery, CFA, CFPⓇ and is not intended to provide financial advice.



Comments
Log in or sign up to join the conversation.