
While aggregate consumption has surpassed peak levels, it hasn’t returned to trend. Furthermore, the composition has changed drastically.
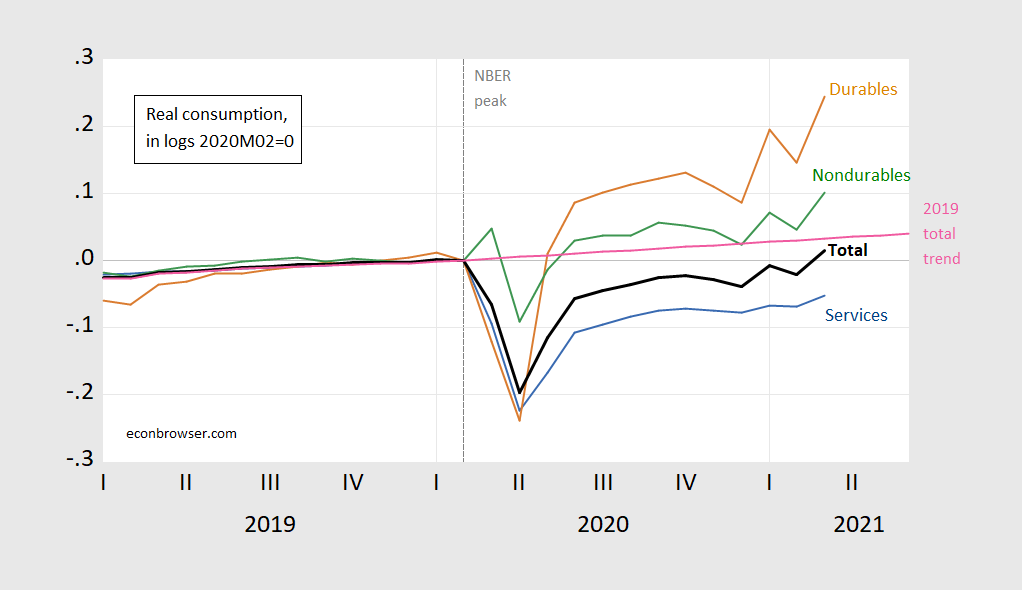
Figure 1: Total consumption expenditures in Ch.2012$ (bold black), services (blue), nondurables (green) and durables (brown), all in logs, 2020M02=0, and 2019 stochastic trend (pink). Source: BEA, NBER, and author’s calculations.
While durables consumption expenditures in March are 24% higher (in log terms) than at NBER peak, and services expenditures are only 5% lower, since services consumption is about 2/3 of total (as of 2012), then overall consumption is only 1.4% higher than prior peak. Total consumption is, incidentally, still 1.8% below 2019 trend.
The compositional effect is shown in Figure 2.
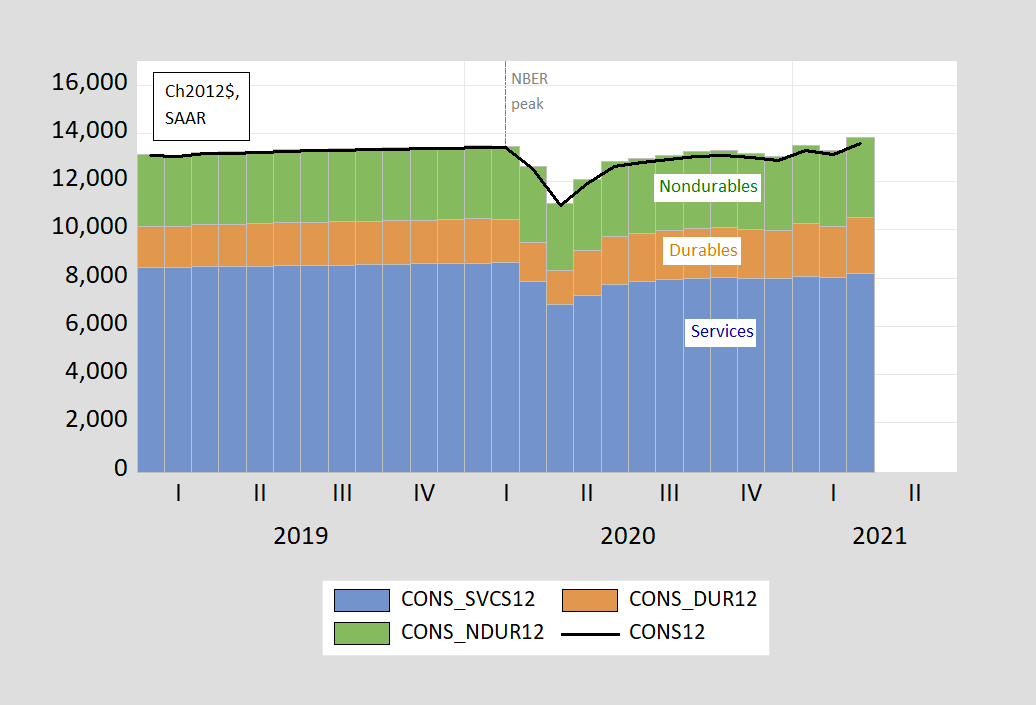
Figure 2: Total consumption expenditures in Ch.2012$ (bold black), services (blue), nondurables (green) and durables (brown). Source: BEA, NBER, and author’s calculations.
Irwin/NYT discusses the changing services/goods composition of GDP.


Comments
Log in or sign up to join the conversation.