

The first stress test for the new Fed Chair, Kevin Harsh, has long since begun. The yield on 30-year U.S. Treasury bonds has already touched the 5.3% mark in recent weeks. Treasury Secretary Bessent has tried to take some pressure off the U.S. debt bubble—but so far with rather limited success.
In Jackson Hole last Friday, Harsh’s speech did at least one thing: trigger a sharp sell-off in precious metals. Otherwise, the market is still puzzling over exactly what he actually meant to say. Communication, in any case, does not seem to be his strong suit.
Whether the market and its participants will have to get used to Harsh—or whether Harsh will eventually have to adapt to the market—is a question best left to the philosophy department. Historically, however, the matter is less philosophical: Following the inauguration of the 16 new Fed chairmen since 1914, the stock market has, on average, experienced a correction of 10.5% within the first six months. The average maximum decline during those first six months was actually 15.2%. New Fed chairmen thus seem to have a certain tradition of initially underestimating Wall Street’s sensitivity. Alan Greenspan learned this the hard way in 1987, with a 23% drop after just two months. Paul Volcker in 1979 and Jerome Powell in 2018 also learned quite quickly that the stock market doesn’t automatically roll out the red carpet for new leaders.
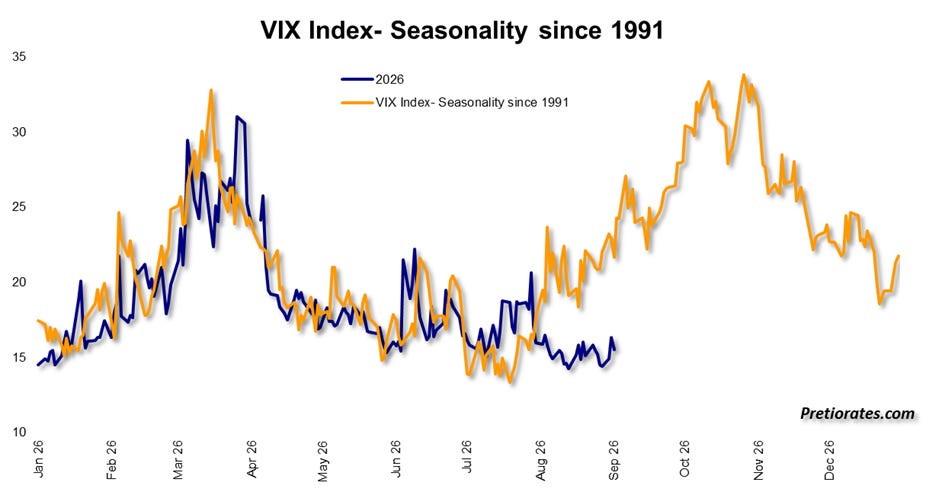
Wall Street measures the extent of these fluctuations using the VIX volatility index. The more nervous the market, the higher the VIX—which is why it’s not without reason that it’s called the “fear gauge.” A few months ago, in Pretiorates’ Thoughts, we already pointed out that the VIX had been tracking the average seasonal pattern since 1991 with remarkable precision. Well, at least until August. Since then, the market seems to have decided to rewrite the script of the past 35 years without further ado. The correction that was actually due has either been called off or is taking its sweet time…
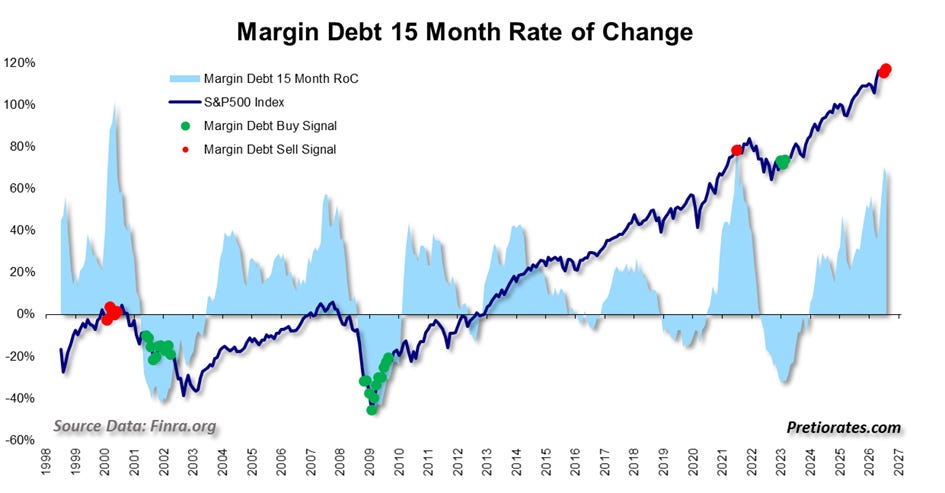
A correction in IT and AI stocks, on the other hand, already took place in July. In Korea in particular, investors took a real beating with credit-financed stock purchases—so-called margin debts. In the U.S. as well, margin debts indicate that speculation with borrowed money has recently been fueling another round of champagne celebrations. Whenever this debt rises too sharply within a 15-month period, it’s a fairly reliable sign that greed is slowly unbuckling its seatbelt. Still, last month, margin debt in the U.S. declined for the first time in quite a while. That’s generally reassuring. However, it remains at a high level. Should a sharp correction suddenly occur, these credit-financed investments in particular could come under massive pressure—and forced sales could quickly turn a normal correction into a self-reinforcing market decline.
Any reader of Pretiorates’ thoughts knows that we remain extremely optimistic about AI and quantum stocks for the coming years. Quantum computers, with their enormous computing power, could catapult AI to an entirely new level—not to mention that AI itself is currently making strides so rapid it’s hard to keep up. In short: We probably haven’t even seen the opening credits yet…
That doesn’t mean, however, that these stocks are immune to corrections. On the contrary: We’re quite amazed at how tenaciously the stock markets are defending their current levels. For while stock prices are pointedly maintaining their composure, the bond markets—with rising yields—are shaking the foundation ever more vigorously. At the same time, the geopolitical developments in Iran and Ukraine certainly give us no reason to break out the party hats just yet.
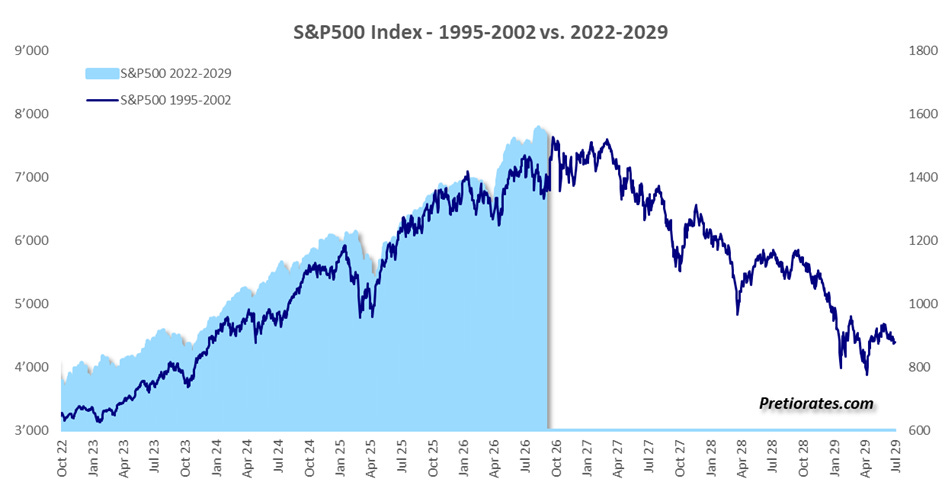
After a long bull market, however, stock markets practically never simply change direction from one day to the next. That’s exactly what our Chart of the Week illustrates. If we compare the performance of the S&P 500 (SPY) between 1995 and 2002 with that since 2022, the picture that emerges is nothing short of astonishing. Essentially, we’re comparing the Internet age with the AI age. The correlation coefficient stands at an astonishing +0.98—which is very close to mathematical perfection. If the current market continues to follow this trajectory, we could be in for a wild roller-coaster ride from now until spring 2027, though the market could ultimately remain above today’s level. After that, however, the historical pattern would point to a multi-year bear market. Exciting? Definitely. A guaranteed stock market roadmap? Certainly not. Above all, the chart shows that investors, acting as a herd, repeat the same mistakes, fears, and bouts of euphoria with astonishing frequency. But any comparison only holds true as long as it holds true. Anyone who doubts this is welcome to take another look at the VIX chart from earlier.
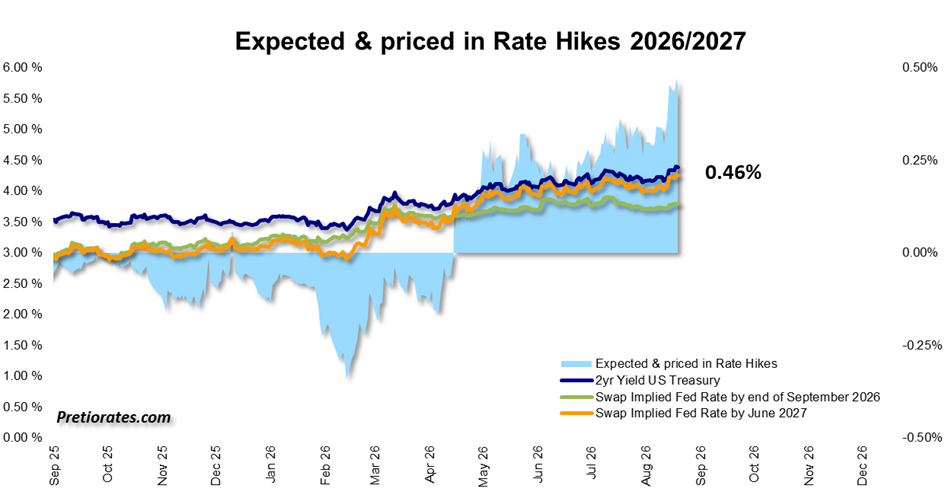
But even if the future trajectory were to eventually deviate from the pattern seen between 1995 and 2002, that would by no means be a free pass for the bulls. The market has recently begun to price in another interest rate hike. Currently, a rate increase of a quarter of a percentage point is expected soon. This is not bullish for the stock markets—and certainly not for Nasdaq (QQQ) stocks, which often pay no dividends.
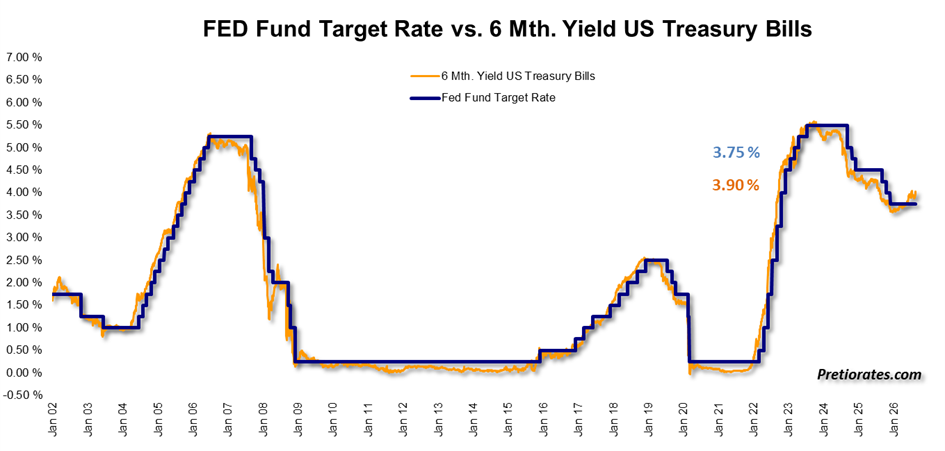
And although market yields have already risen sharply—making it increasingly difficult to sweep the U.S. debt problem under the rug—the market is currently pricing in a total interest rate hike of half a percentage point by mid-2027.
This is likely one reason why hedge funds have recently shifted their net exposure back toward short positions.
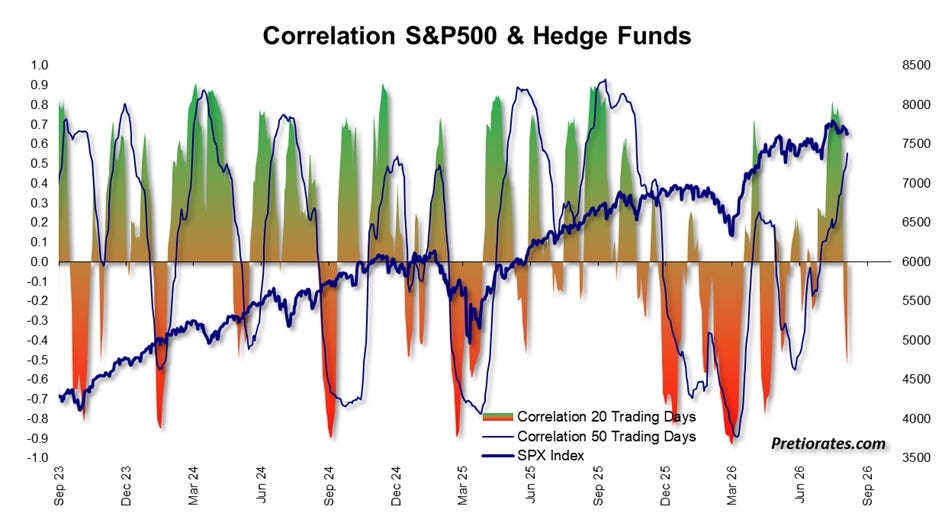
If even professional speculators are becoming more cautious, we “ordinary” investors don’t necessarily have to be the last ones to storm the dance floor. After all, there are quite a few fuses lying around right now. And on the stock market, it sometimes takes surprisingly little spark to turn them into a pretty big fireworks display.

Comments
Log in or sign up to join the conversation.