
The undershoot in nonfarm payroll employment is noticeable, with a flattening in high contact services employment growth.
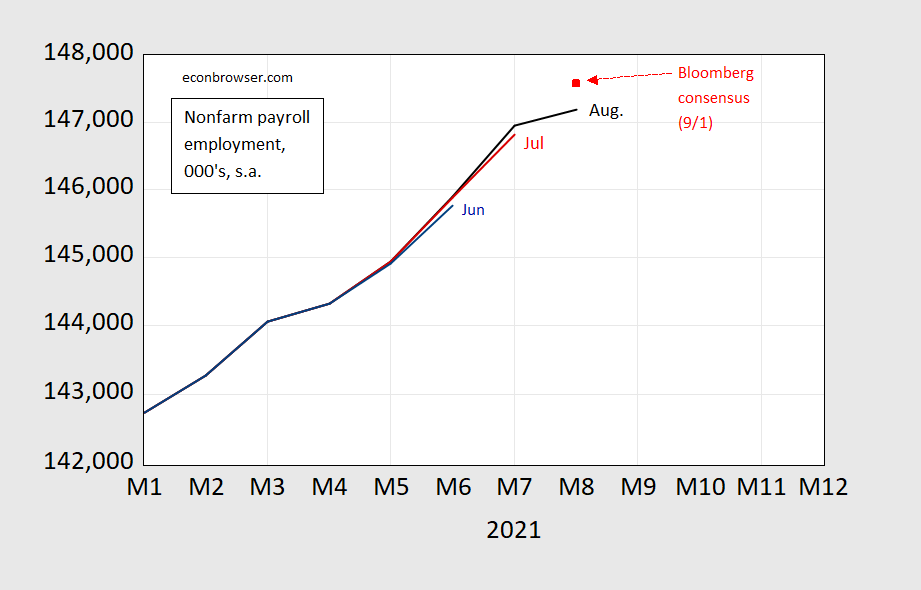
Figure 1: Nonfarm payroll employment from June release (blue), July release (red), and August release (black), and August Bloomberg consensus implied level (red square). Source: BLS, Bloomberg (9/2), author’s calculations.
The Bloomberg consensus was consistent with constant growth rate; the miss was over 500K.
Employment from the household survey rose faster (twice as fast in August), but not enough to change the picture dramatically.
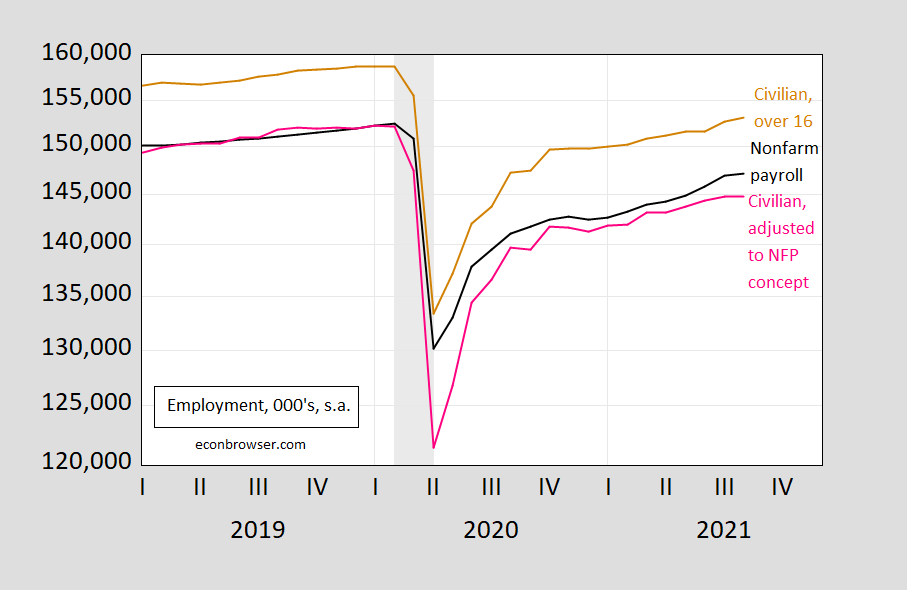
Figure 2: Nonfarm payroll employment (black), civilian employment over 16 (brown), and civilian employment adjusted to the NFP concept (pink). NBER defined recession dates shaded gray. Source: BLS, NBER.
Over the past year, civilian employment and nonfarm payroll employment growth as been about the same (3.9% vs. 4.2%). Civilian employment redefined to the NFP concept is a bit slower, at 3.6%.
Figure 3 highlights the fact that goods production employment (specifically manufacturing) continues to grow, while accommodation and food services employment growth declines slightly (the broader category of leisure and hospitality is flat).
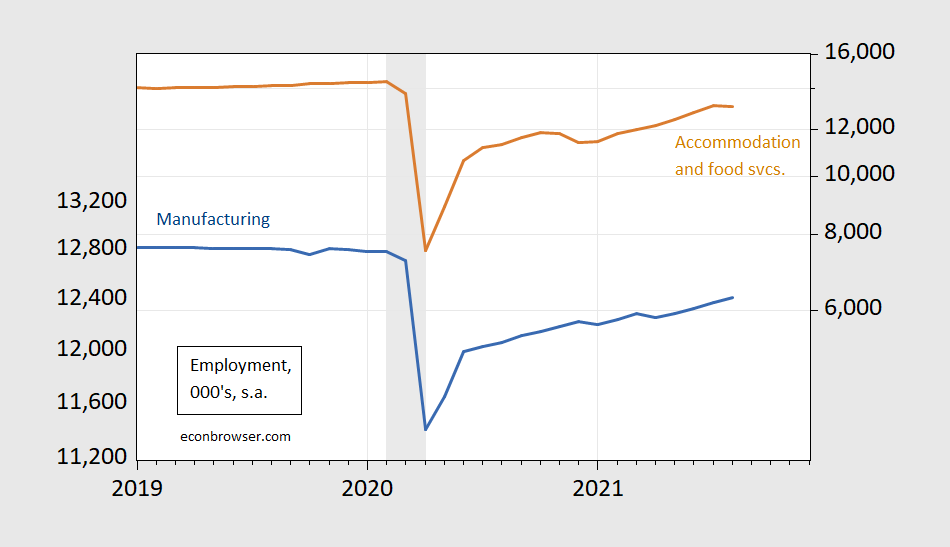
Figure 3: Employment in manufacturing (blue, left log scale), in accommodation and food services (brown, right log scale). NBER defined recession dates shaded gray. Source: BLS, NBER.
Had employment in accommodation and food services risen the same amount in August as it did in July (363K), and all other categories grew as they did, then nonfarm payroll employment would have grown by nearly 400K more (i.e., 635K vs. 435K actual).
Torsten Slok observes (note, 9/3):
…The delta variant held back hiring in Leisure and hospitality in August, but employment moved up in Warehousing and storage and Couriers and messengers. Overall, employment in Couriers and messengers is 17% higher than its pre-pandemic level. The bottom line is that covid held back hiring in August. With the expected peak in delta, we should begin to see jobs growth pick up again over the coming months.
The CDC forecast of 8/30 (posted 9/1), below:
(Click on image to enlarge)
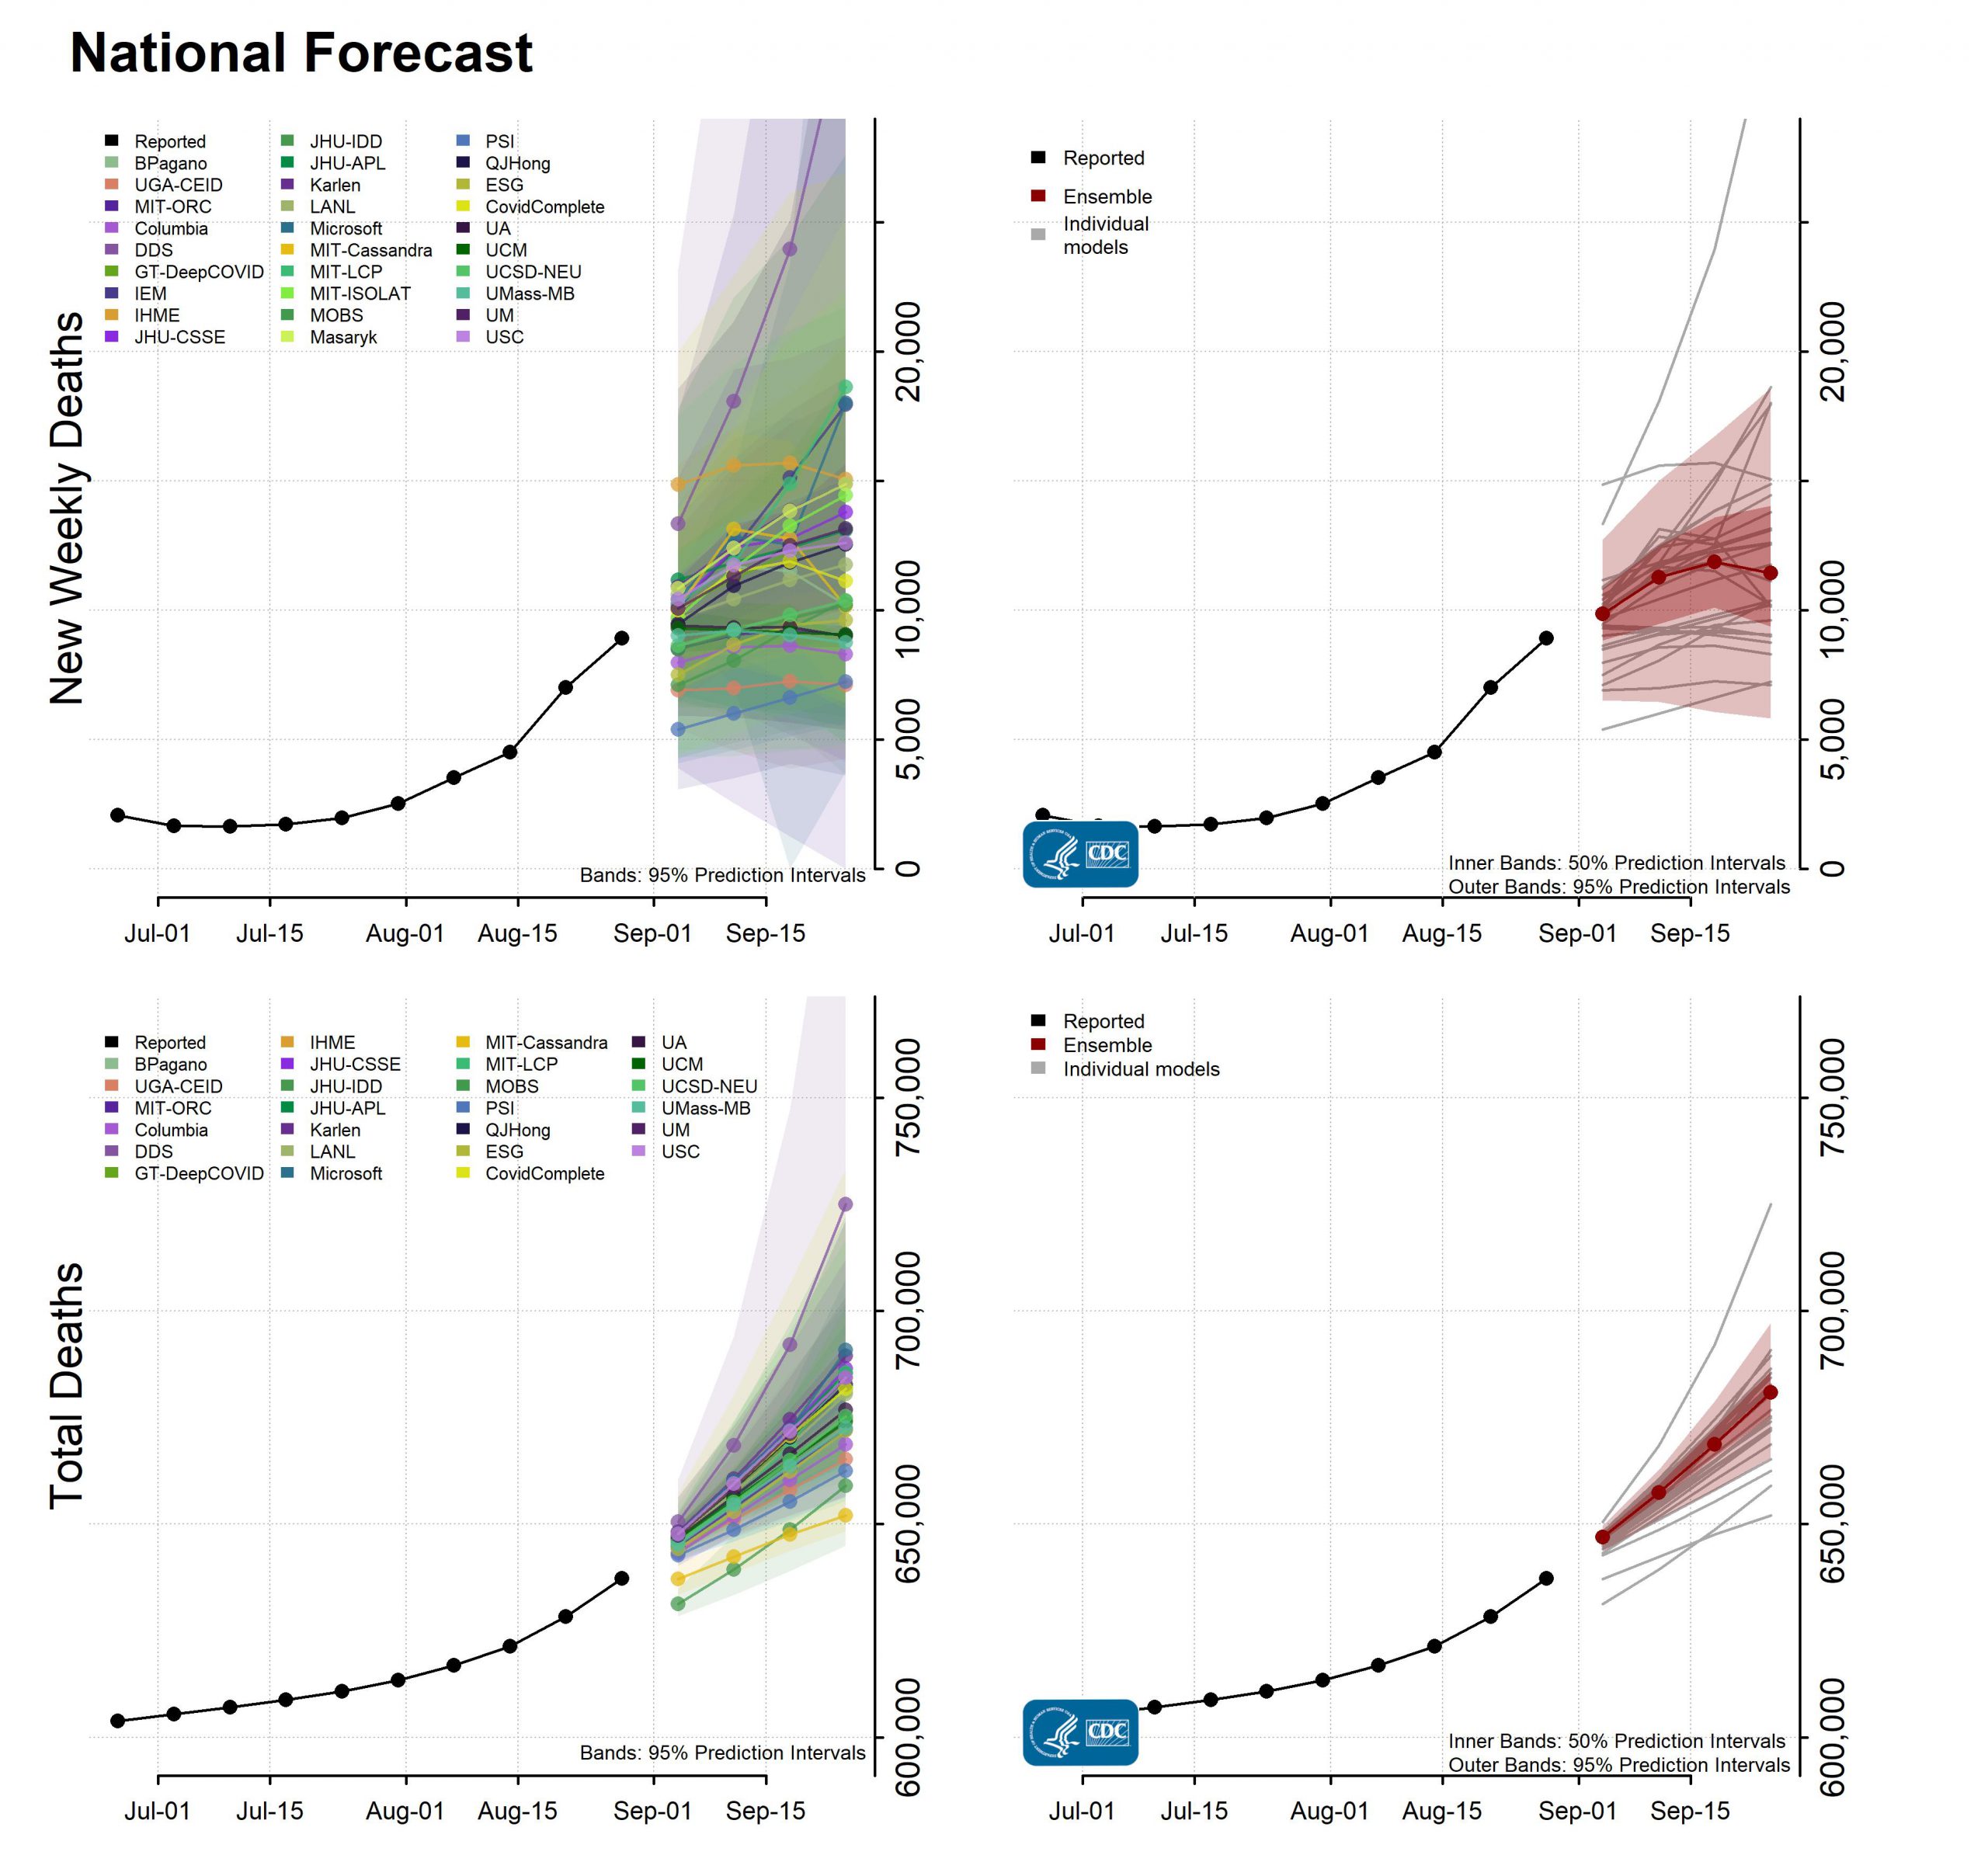
Source: CDC, accessed 9/6.
The CDC ensemble model places peak deaths at about 2 weeks from now (3 weeks from 8/30). The question in my mind is whether the individual models underlying the CDC ensemble model incorporate the effects of Labor Day travel and the opening of schools — both K-12 and college/university.
The dualistic nature of the recovery also shows up in wage data.
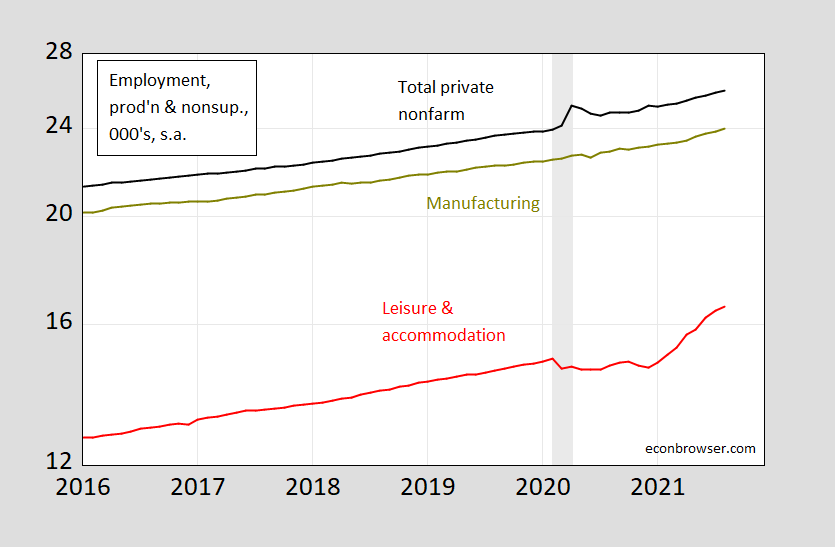
Figure 4: Average hourly earnings in total private earnings (black), in manufacturing (chartreuse), and in leisure and hospitality services (red), $/hour for production and nonsupervisory workers. Source: BLS.
Wage growth has accelerated (as shown by the steepening slope) in the aggregate and in manufacturing. However, wage growth in leisure and accommodation only accelerated as vaccination began — and has continued until exceeding the pre-pandemic trend (5% in log terms). The lack of clear evidence that enhanced benefits have driven a reduction in labor supply means that it’s possible the rising wages are due to other factors depressing supply (fears of exposure to Covid-19, other compensating differentials, or child or parental care constraints, etc.).


Comments
Log in or sign up to join the conversation.