

The Macro Reality: A Transition to Debt-Fueled Growth
Think about how this AI cycle actually started. Back in late 2022, it was just a software race. Now? It has morphed into a massive, capital-heavy physical infrastructure mandate for 2026. Building generative AI globally requires serious hardware: advanced semiconductors, specialized networking equipment, high-density cooling systems, and massive hyperscale data centers.
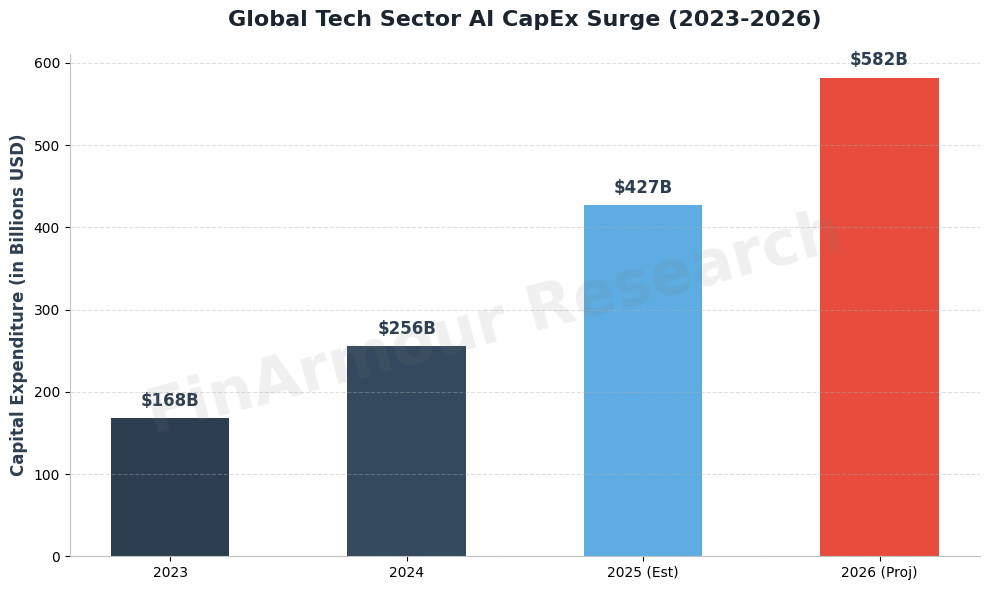
The hyperscalers—Amazon (AMZN), Alphabet (GOOGL), Meta (META), Microsoft (MSFT), and Oracle (ORCL)—are spending at a pace that is hard to wrap your head around. When I look at the collective capital spending across the tech sector, the trajectory is staggering. It hit $168 billion in 2023, climbed to $256 billion in 2024, and reached an estimated $427 billion in 2025. Looking into 2026, consensus estimates project this total will surge to anywhere between $562 billion and $602 billion. That’s a massive 30% to 36% jump year-over-year.
Let's break down the specific forward guidance. Amazon alone is expected to spend roughly $200 billion in 2026. Alphabet follows closely at $175-$185 billion, Meta at $115-$135 billion, and Microsoft over $120 billion. About 75% of this combined total—roughly $450 billion—is going directly into AI infrastructure.
For years, institutional funds loved these big tech companies for one main reason: their "asset-light" business models. They printed cash through high-margin software subscriptions, intellectual property, and digital ad platforms. This dynamic allowed them to easily fund organic growth straight from their operating cash flows.
But the AI boom completely broke that math. Entering 2026, the aggregate CapEx budgets of the major hyperscalers are actually outpacing their projected free cash flows—even after accounting for mandatory buybacks and dividends. Capital intensity for these firms has spiked to 45% to 57% of total revenue. We simply haven't seen capital intensity at this level in the tech sector before.
So, how do they cover the massive gap between what they earn and what they need to build? They are tapping the debt markets. Hard. In 2025 alone, the top five tech giants (Amazon, Alphabet, Meta, Microsoft, and Oracle) issued $121 billion in US corporate bonds. To put that in perspective, their historical average was just $28 billion per year from 2020 to 2024.
The numbers get even more alarming. By October 2025, AI-tied debt reached $1.2 trillion. That makes up 14% of the entire investment-grade market. Tech is now the largest single sector in the JPMorgan US Liquid Index, surpassing even US banks. Wall Street analysts expect the sector will need to issue another $900 billion to $1.5 trillion in new debt over the next few years just to keep up with this buildout.
The Institutional Rulebook: Leverage Covenants
Let's talk about the institutional rulebook for a minute. When evaluating the structural risks facing the tech sector in 2026, I always look closely at the multi-tiered screening processes used by institutional fund managers. We are talking about strict mandates from the Accounting and Auditing Organization for Islamic Financial Institutions (AAOIFI), alongside major index providers like S&P Dow Jones, FTSE Russell, and MSCI. It's not enough to just pass basic qualitative screens anymore. A publicly traded stock must clear very strict quantitative financial ratios to prove its capital structure is actually compliant.
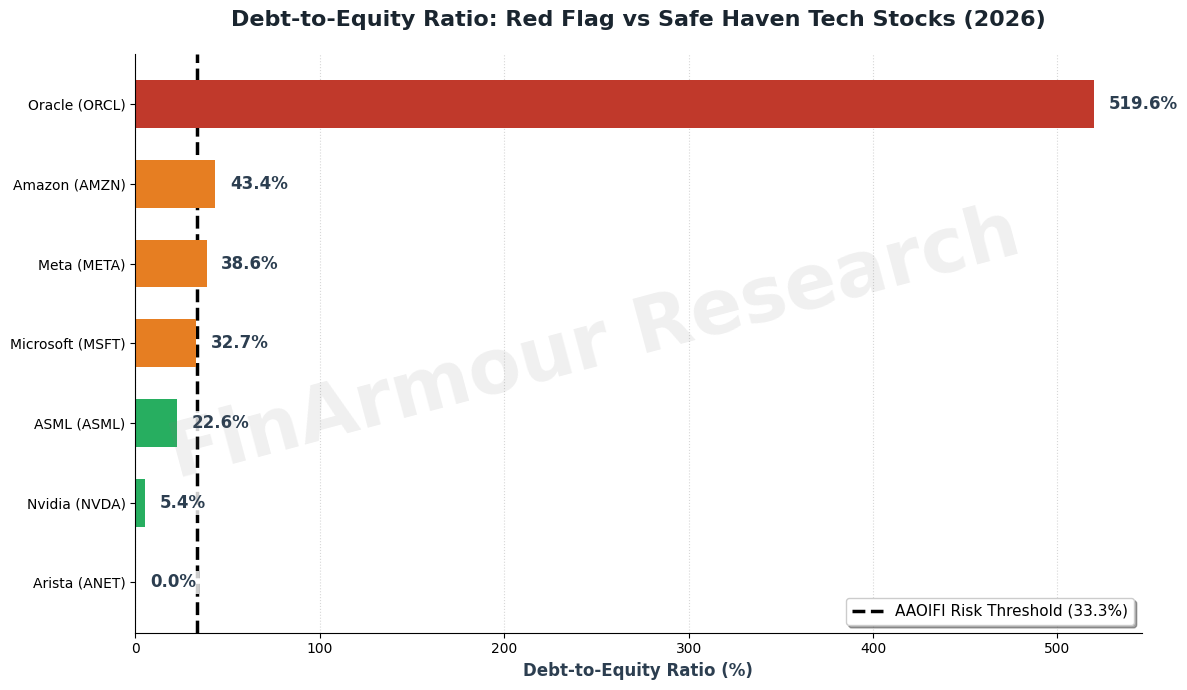
1. The Leverage Rule (Debt Ratio): The rule is simple: total interest-bearing debt cannot cross 33.33% of a company's Total Assets. Depending on the specific board you look at, this might also be calculated as 33.33% of the trailing 12-month average Market Capitalization. Regulators are tightening these rules globally. Just look at the Securities and Exchange Commission of Pakistan (SECP). They recently stepped in to boost investor confidence by dropping the allowable non-compliant debt-to-assets ratio from 37% down to a strict 33%.
2. The Impermissible Income Rule: Any revenue coming from non-compliant activities cannot make up more than 5% of a company's total gross revenue. For tech companies, this is a massive catch. Why? Because this explicitly includes the interest income earned on their massive cash reserves and short-term investments.
But here is where things get really complicated. How institutions actually apply this 33.33% debt rule varies, and it creates a massive screening loophole in highly volatile markets. If you use Total Assets (TA), you are relying on historical book value. This naturally penalizes tech companies. Why? Because they carry huge intangible assets and heavily depreciated hardware on their balance sheets. On the flip side, using Market Capitalization allows for real-time screening. It uses a trailing average to smooth out those seasonal bumps.
This creates a dangerous trap for Big Tech. These companies trade at massive premiums—often 10x to 15x their actual book value. When you use Market Capitalization as the divisor, you can easily hide massive piles of absolute debt. Think about it. A tech giant carrying $100 billion in interest-bearing debt but sitting on a $2 trillion market cap easily passes the test with a mere 5% ratio. But what happens if macroeconomic shocks, tariff fears, or a sudden "AI bubble" realization wipes 30% to 40% off the tech sector? The denominator shrinks instantly. Suddenly, their debt ratio spikes dangerously close to the 33.33% limit. And they haven't even issued a single new bond to trigger it.
To add another layer of risk, AAOIFI is rolling out Sharia Standard 62. This is set to seriously shake up the Sukuk market starting in 2026. This new standard could potentially reclassify certain asset-backed instruments and leases from debt-like to equity-like, based on strict collateral and transfer rules. In short, it is going to heavily disrupt exactly how corporate debt is categorized moving forward.
The "Red Flag" Tech Giants
When the sheer cost of AI CapEx starts blowing past the actual cash these companies generate, you start seeing major cracks in traditional tech portfolios. This is especially true when it comes to leverage limits.
Oracle Corporation (NYSE: ORCL)
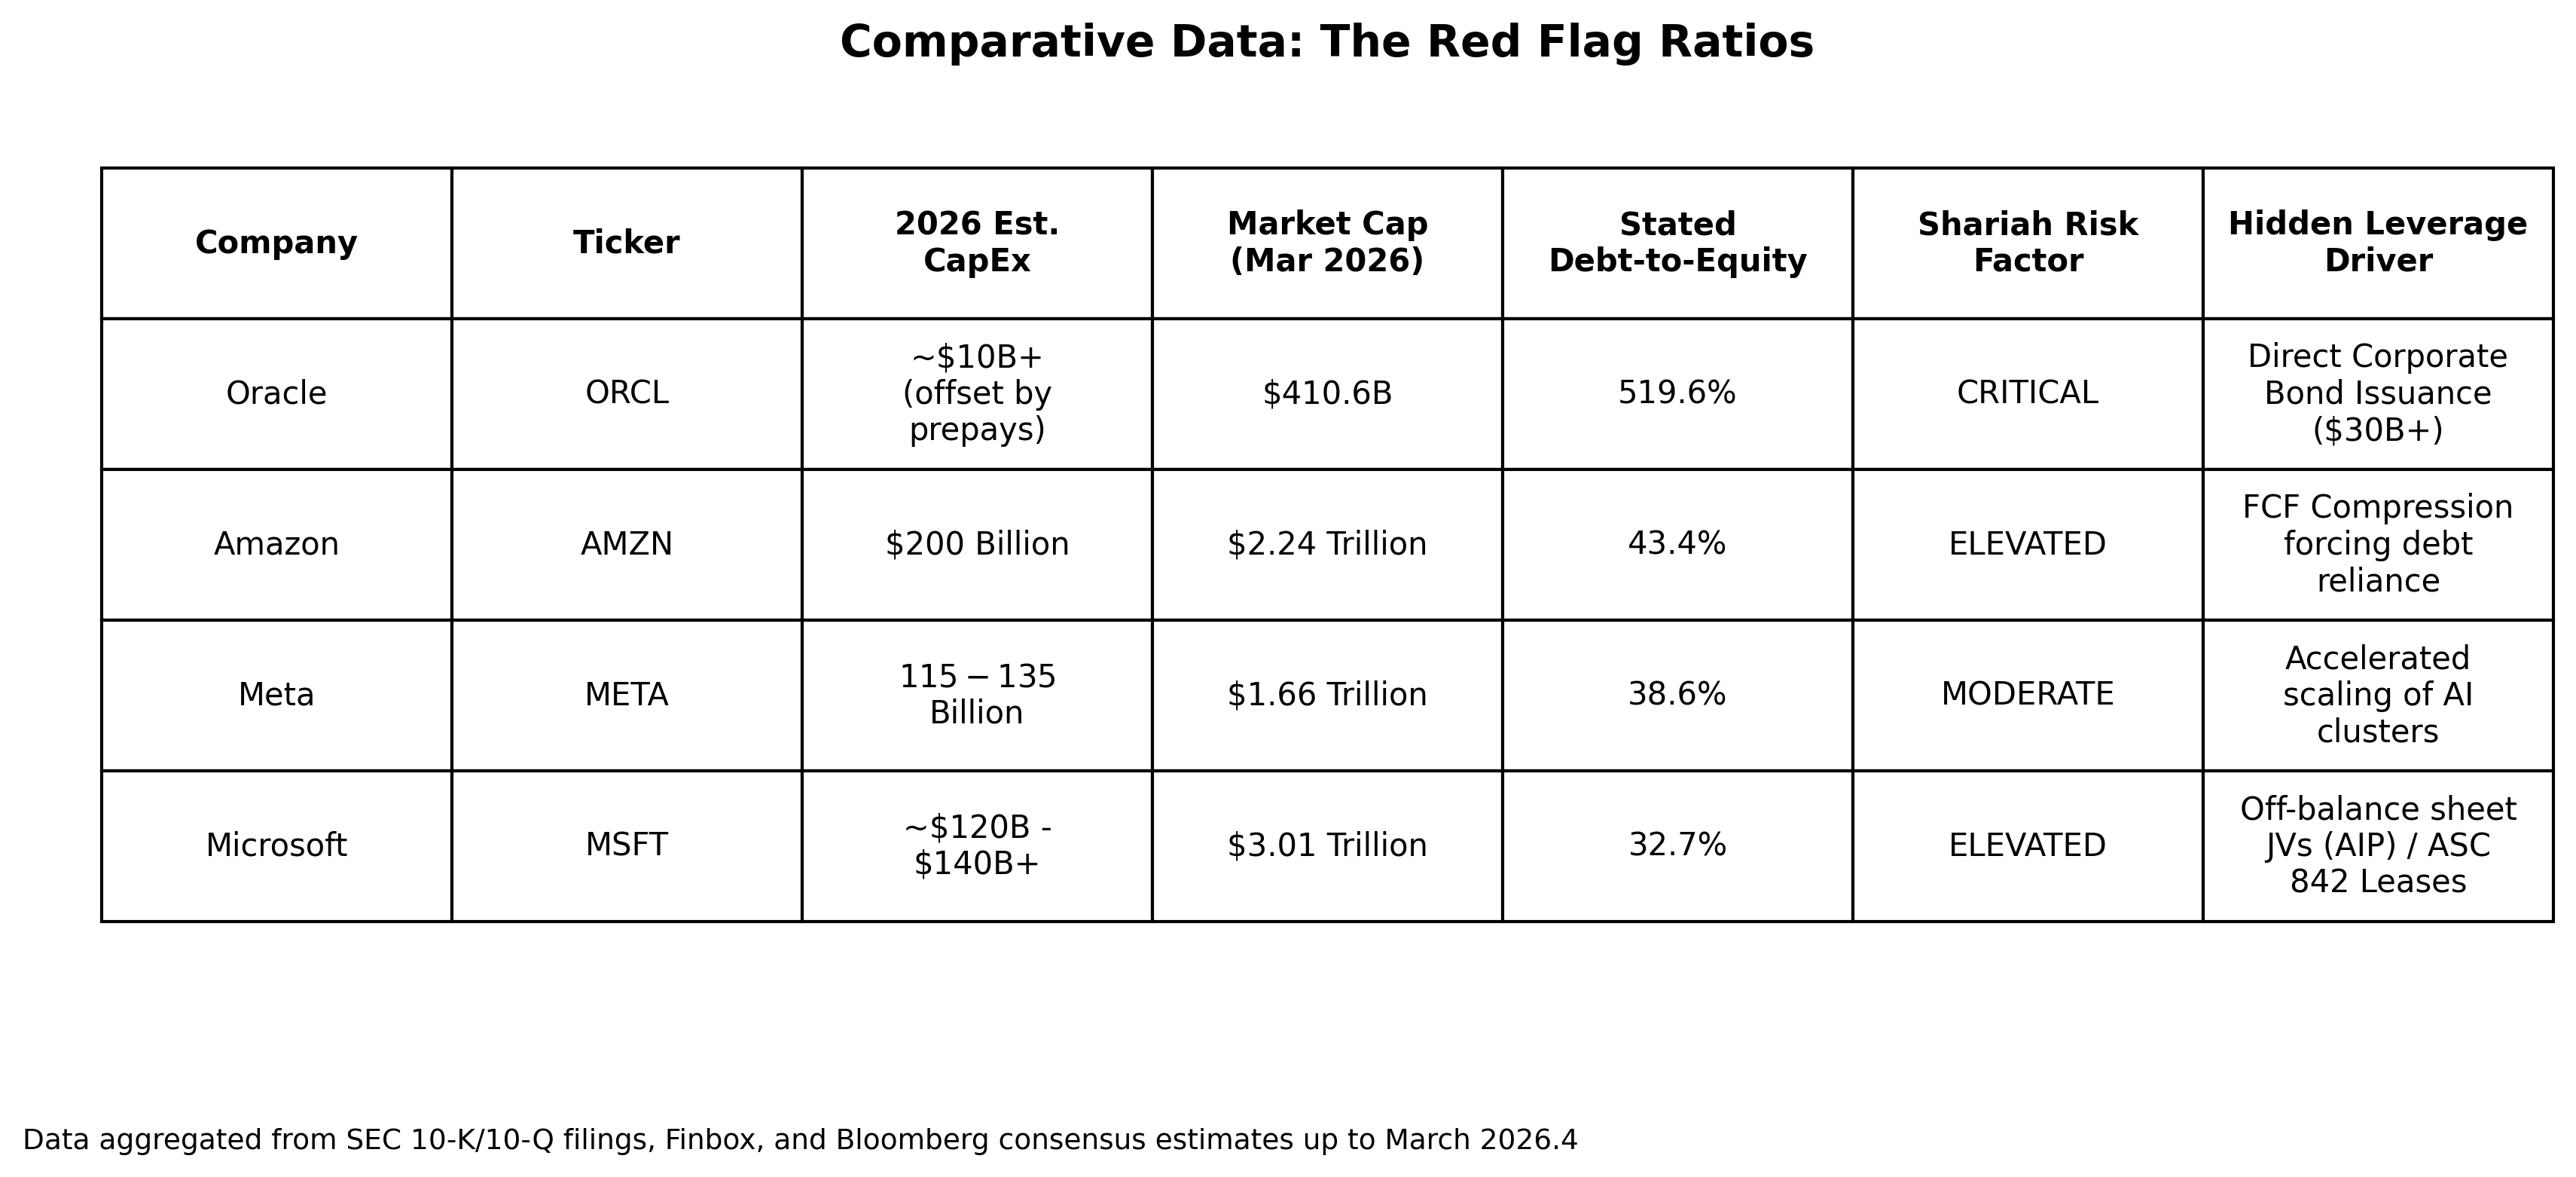
Oracle is going all-in on the AI cloud infrastructure race. They are clearly trying to grab market share by catering to massive, compute-heavy clients like AMD (AMD), Meta, Nvidia (NVDA), OpenAI, and xAI. But look at how they are funding it. They just rolled out a plan to raise between $45 billion and $50 billion in gross cash proceeds in calendar 2026, mixing both debt and equity. By Q3 of fiscal year 2026, Oracle’s Remaining Performance Obligations (RPO) spiked to an incredible $553 billion. That is a massive 325% jump from the previous year.
Right now, Oracle is easily the most highly leveraged name in the mega-cap tech space. I found their Debt-to-Equity ratio has exploded to a completely unsustainable 519.6%. Sure, management likes to point out that these large-scale AI contracts are often funded upfront through customer prepayments for GPUs. But you simply cannot ignore the absolute debt load. That metric alone puts Oracle straight onto the immediate exclusion list for strict Total Asset-based screens. Just to put it in perspective: in February 2026, they raised $30 billion using a mix of investment-grade bonds and mandatory convertible preferred stock.
Amazon.com, Inc. (Nasdaq: AMZN)
Amazon has lined up a massive $200 billion CapEx plan for 2026. Most of this is laser-focused on AWS AI infrastructure, custom silicon chips (Trainium and Graviton), robotics, and low-earth orbit satellites. On the surface, their operating cash flow looks incredibly strong at $139.5 billion for the trailing twelve months.
But let's dig a little deeper. Their free cash flow completely fell off a cliff, dropping to just $11.2 billion. Why? Because they saw a massive $50.7 billion year-over-year jump in property and equipment purchases. Let’s look at the balance sheet. Amazon is carrying $77.0 billion in total debt against shareholder equity of $411.1 billion. Depending on whether you include specific long-term lease liabilities, their debt-to-equity ratio swings wildly—anywhere from 18.7% to 43.4%. Also, looking at recent quarters, they generated $1.1 billion in interest income against $679 million in interest expense. This massive gap between surging CapEx ($200B) and shrinking free cash flow ($11.2B) is the exact financial catalyst forcing a hyperscaler to tap the corporate bond market.
Microsoft Corporation (Nasdaq: MSFT)
I expect Microsoft’s 2026 CapEx to land somewhere between $120 billion and $140 billion. This is heavily driven by the massive demand for Azure AI services and their compute obligations to OpenAI and Anthropic. If you look at their officially reported numbers, long-term debt sits at around $59 billion. That gives them what looks like a modest stated long-term debt-to-equity ratio of roughly 9.1% to 32.7% (inclusive of current liabilities).
But here is where you have to read the fine print. Their true capital intensity is hidden behind some very smart financial structuring. Between late 2024 and expanding aggressively through 2026, Microsoft partnered up with BlackRock, Global Infrastructure Partners (GIP), and MGX to launch the AI Infrastructure Partnership (AIIP). This is a $100 billion data center joint venture. The trick here is that about 70% of the debt leverage sits at the fund level, not on Microsoft’s corporate balance sheet. They contribute the equity to the partnership, but you won't see that debt in Microsoft’s 10-K filings.
On top of that, you have to factor in the accounting standards of ASC 842. Under these rules, Microsoft’s massive data center operating leases are capitalized right onto the balance sheet as right-of-use assets and corresponding lease liabilities. Without issuing a single traditional bond, this directly inflates their total debt metrics and debt-to-equity ratios.
The "Safe Haven" Tech Stocks
While the hyperscalers are busy loading up on debt to build the physical cloud, my focus is elsewhere. I am looking at the companies actually supplying the picks and shovels for this AI gold rush. These hardware, semiconductor equipment, and networking firms are cash-generating machines. They fund their own innovation organically without begging the bond market. The result? I am seeing pristine balance sheets with debt-to-equity ratios routinely sitting below 10%.
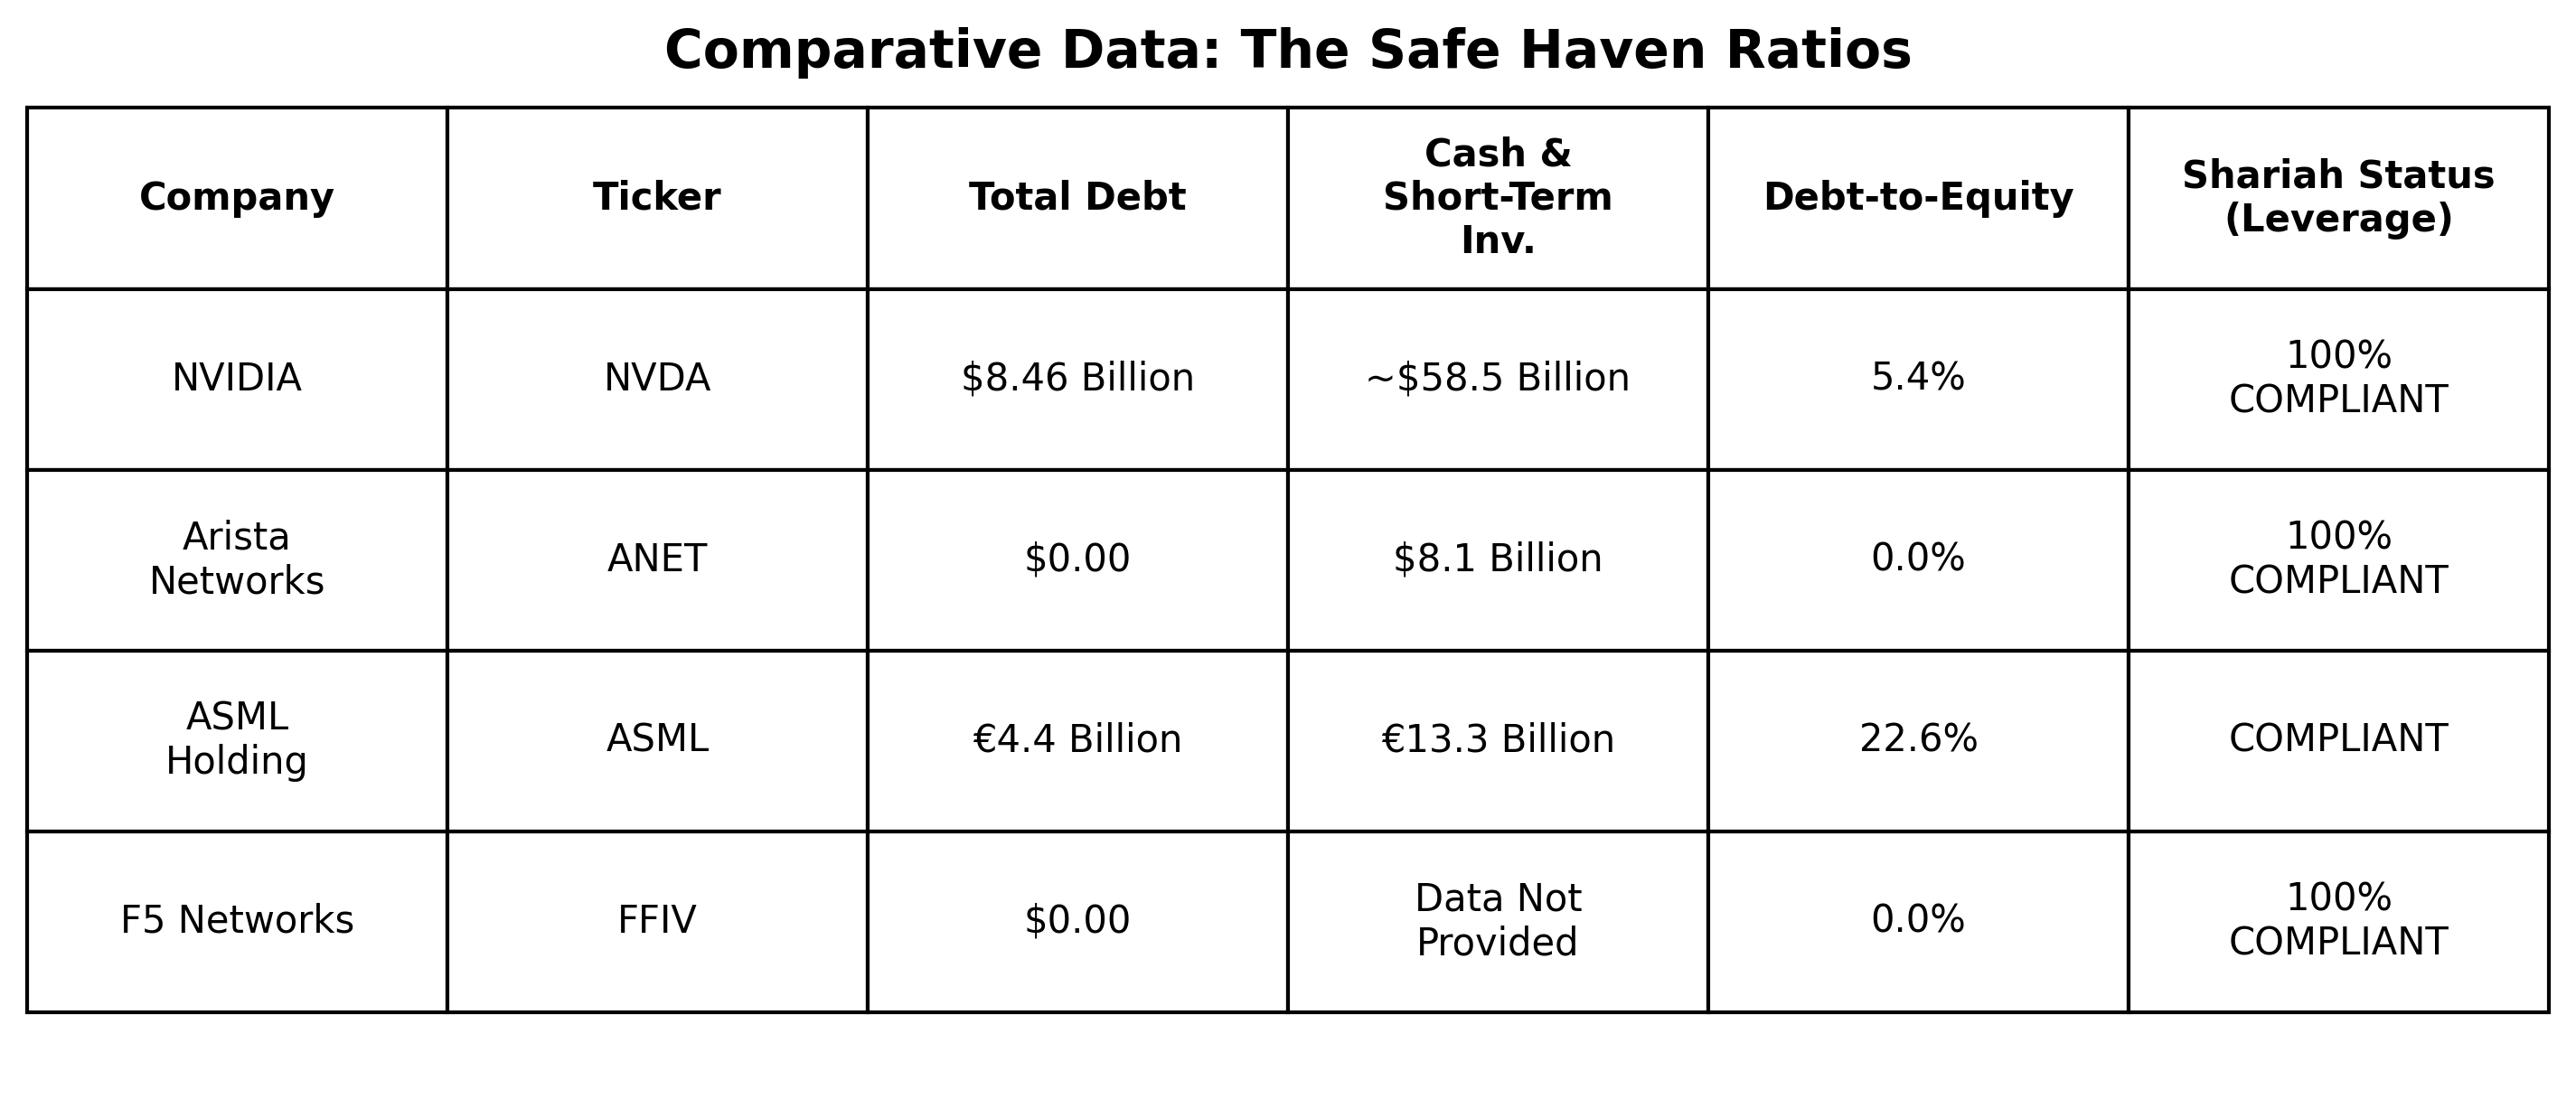
Nvidia Corporation (Nasdaq: NVDA): Take Nvidia, for example. They just reported a record fiscal 2026 revenue of $215.9 billion. That is a staggering 65% jump year-over-year. But honestly, what stands out to me the most isn't the growth—it’s the balance sheet. They hold $157.2 billion in total equity against a mere $8.46 billion in total debt. That gives them an exceptionally low debt-to-equity ratio of just 5.4%. To make things even safer, their operating cash flow covers this debt load by a ridiculous 1213%. And if that wasn't enough, they still have $58.5 billion left in share repurchase authorizations.
Arista Networks, Inc. (NYSE: ANET) Arista provides the high-performance ethernet switches that these massive AI data centers desperately need. When I pulled their financial filings up through Q1 2026, the numbers were almost hard to believe. They are sitting on $8.1 billion in cash, cash equivalents, and marketable securities. Their total debt? Exactly $0.00. With a debt-to-equity ratio of effectively 0%, the company easily holds $12.4 billion in shareholder equity against total liabilities of just $7.1 billion. That is the definition of a bulletproof balance sheet.
ASML Holding N.V. (NASDAQ: ASML) This Dutch semiconductor equipment maker holds a literal global monopoly on Extreme Ultraviolet (EUV) lithography machines. The financials reflect that power. For FY 2025/2026, ASML posted net sales of €32.7 billion, boasting a gross margin of 52.8% and a net income of €9.6 billion. Yes, they do carry some debt—about €4.4 billion— but look at what it sits against: €19.4 billion in equity. This results in a highly manageable 22.6% debt-to-equity ratio. Plus, their €13.3 billion in cash reserves easily services this leverage. It’s exactly why they were able to confidently return €8.5 billion to shareholders in recent periods.
F5 Networks (NASDAQ: FFIV): Looking at the cybersecurity and application delivery space, F5 Networks stands out for one simple reason. They are operating with a long-term debt-to-equity ratio of exactly 0.0%. Compare that pristine metric to the broader Information Technology sector, which currently averages a long-term debt-to-equity ratio of 18.4%. It becomes immediately clear why they belong on this safe-haven list.
The Dividend & Income Trap
There is a massive irony playing out right now with these "Safe Haven" tech stocks. Their operational success is actually creating a secondary headache for compliance teams: The Impermissible Income Trap. If you follow strict AAOIFI standards, a company cannot derive more than 5% of its total gross revenue from non-permissible sources. It is a hard line.
Think about the current elevated interest rate environment we are navigating in 2025 and 2026. Those massive corporate cash reserves I mentioned earlier? They are spinning off a ton of interest income. I dug into Nvidia's Fiscal 2026 10-K filing to see the real numbers, and they reported earning $2.30 billion just in interest income alone. That is a very notable jump from $1.78 billion the year before. Amazon sits in a similar boat, generating $1.1 billion in interest income across recent quarters. Fortunately for Nvidia, they pulled in an astounding $215.93 billion in total revenue for FY26. That means the $2.30 billion in interest only makes up roughly 1.06% of their top line. So, yes, Nvidia easily clears the 5% hurdle.
But here is the catch: passing the screen is not the end of the story. Compliance mandates require that any income an investor receives that is tainted by this interest must be "purified." What does that mean for institutional fund managers? They are officially on the hook. They have to calculate and report a "Purification Ratio," actively deducting that exact non-compliant slice from their earnings. Let me break down exactly how this straightforward calculation works.
1. Determine the Non-Permissible Revenue Ratio (NPRR):
NPRR = Total Impermissible Income (Interest) / Total Gross Revenue
When I run Nvidia's official FY26 SEC data through the formula, it looks like this:
Interest Income: $2,300,000,000
Total Revenue: $215,938,000,000
NPRR = 2,300,000,000 / 215,938,000,000 = 0.01065 (or 1.065%)
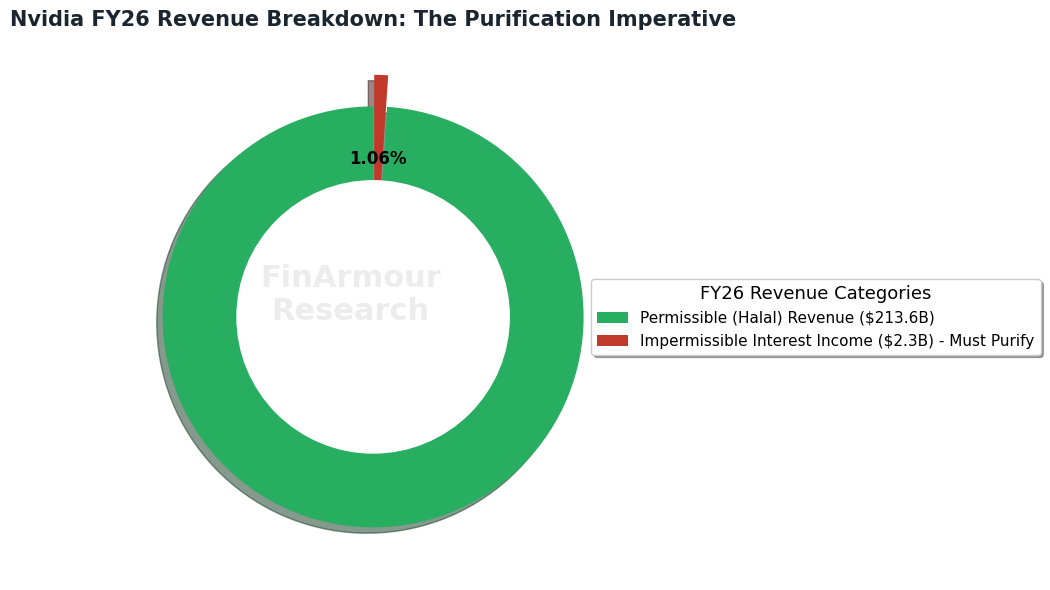
Chart created by author 2. Calculate the Dividend Purification Amount:
Let's assume an institutional fund is holding a $50,000,000 position in Nvidia and receives a total annual dividend payout of $100,000.
Purification Amount = Total Dividend Received x NPRR
Purification Amount = $100,000 x 0.01065 = $1,065.00
So, what does this actually mean in practice? It means the institutional fund manager has to manually deduct that $1,065.00 straight from the fund's yield and donate it to an approved charity. As corporate cash piles keep growing throughout 2026, tracking and executing these micro-purifications turns into a massive, ongoing quarterly chore. Especially when you consider these usually average around 1.0% to 1.5% of total revenue across a portfolio of 100+ global tech stocks. It is an absolute administrative nightmare.
The Q3/Q4 2026 Market Outlook
Let me zoom out for a second. You really cannot look at all this debt accumulation or interest income without factoring in the broader macroeconomic picture. After making aggressive rate cuts totaling 175 basis points through late 2024 and 2025, the Federal Reserve finally decided to pause. They held the federal funds rate steady at a range of 3.50% to 3.75% in January 2026. Right now, with the US unemployment rate stabilizing around 4.4%, the analyst consensus is a bit split. JP Morgan Global Research expects the Fed to stay on hold for most of 2026. Goldman Sachs, on the other hand, is projecting a slight easing—aiming for a terminal rate between 3.00% and 3.25% by the end of the year.
But here is the ultimate reality check. Even if we actually hit that ~3.25% terminal rate, it is still an absolutely brutal setup for the hyperscalers. Why? Just factor in the projected $900 billion to $1.5 trillion in upcoming AI debt issuance. These tech giants are staring down massive, ongoing debt-servicing costs. From my perspective, this will inevitably compress their net margins. In the worst-case scenarios, I could even see it forcing them into a vicious cycle: taking on new debt just to maintain daily operational liquidity and keep up with their dividend payouts.
Across the Atlantic, however, the story looks a bit different. The ECB is playing things slightly looser. They held their benchmark main refinancing rate at 2.15% in early 2026, but they actually upgraded their 2026 growth forecast for the euro area to 1.2%. This creates a highly favorable macroeconomic backdrop for low-debt European tech champions. Just look at ASML. Or take the enterprise software giant SAP (SAP)—which, amazingly enough, still maintains a completely 0% financial debt ratio.
Strategic Verdict
Let me make one thing crystal clear: the era of passive, "set-and-forget" tech investing is officially over. This 2025-2026 AI CapEx cycle is so massive that it has fundamentally rewired the capital structures of the entire global technology sector. If institutional investors are still simply relying on a trailing 12-month market capitalization as their primary divisor, they are walking blind into severe, hidden portfolio risks.
Based on my analysis of these real-time CapEx forecasts and digging deep into off-balance-sheet leverage, here is exactly how I view strategic allocations heading into Q4 2026:
AVOID (Divest/Exclude): Oracle (ORCL). I really cannot stress this enough. With a Debt-to-Equity ratio completely blowing past 500% and public commitments to issue another $45 to $50 billion in mixed debt and equity for data centers, Oracle is a massive red flag. For institutional portfolios, it represents a walking compliance failure.
HOLD (Monitor Closely): Microsoft (MSFT), Amazon (AMZN), and Meta (META). Yes, these giants are spending heavily on CapEx ($120B+, $200B, and $115B+ respectively). But there are underlying issues. Between Amazon's compressing free cash flow and Microsoft's reliance on heavily leveraged external joint ventures like the AIIP, you have to watch these names like a hawk every single earnings cycle. If their market caps take a sudden hit, they are going to breach those strict compliance covenants almost instantly.
BUY (Overweight Allocation): NVIDIA (NVDA), Arista Networks (ANET), ASML Holding (ASML), and F5 Networks (FFIV). This is where the smart capital needs to rotate. If you want to capture the AI infrastructure boom safely, you need to own the hardware and networking companies actually supplying the hyperscalers. These specific names bring exactly what you want to the table: near-zero debt-to-equity ratios, organic cash-funding models, and the proven ability to generate massive amounts of free cash flow.
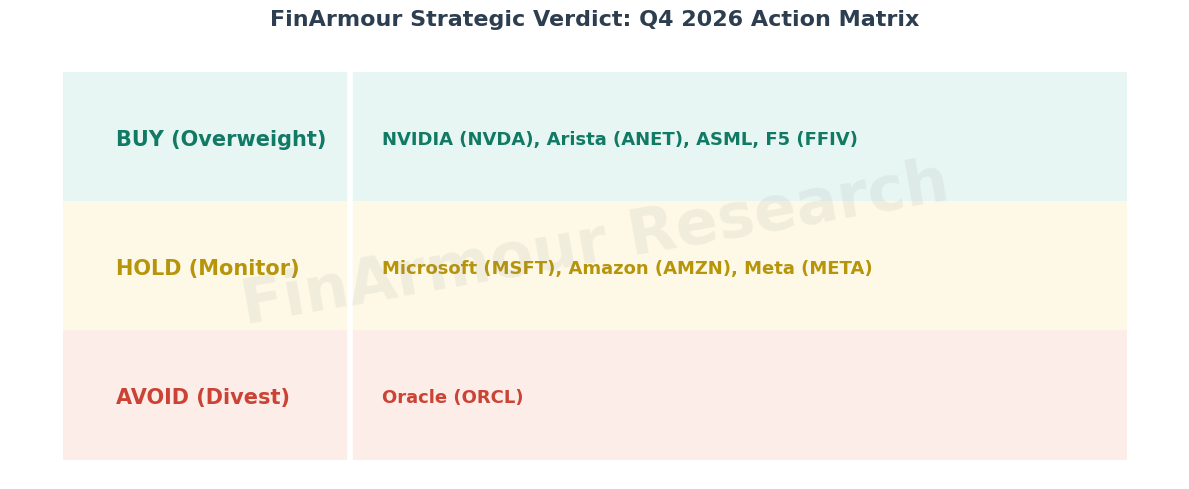
Chart created by author

Comments
Log in or sign up to join the conversation.