

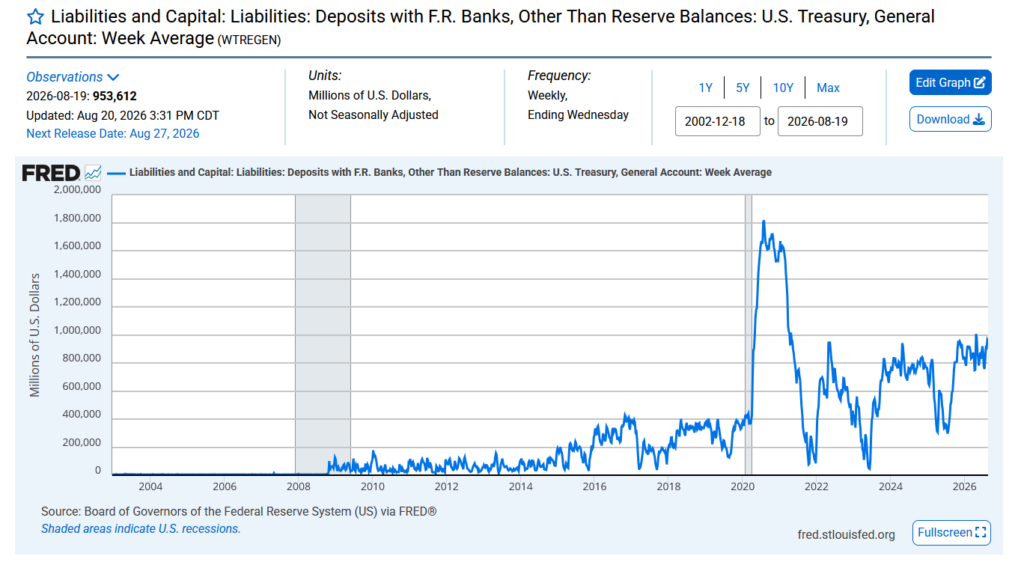
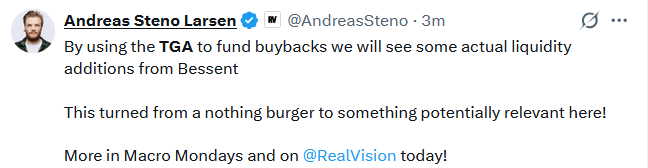
The Treasury General Account (TGA) is Treasury’s cash balance held at the Federal Reserve. Its balance is the net of cash inflows like tax receipts and outflows to pay the government’s bills. On Monday, we learned that Treasury Secretary Scott Bessent may fund the expanded Treasury bond buyback program by tapping the TGA.
Currently, as the graph below shows, the TGA balance is just shy of $1 trillion. The balance has crossed $800 billion several times since 2020, but every prior instance had a trigger.
The 2020 spike to $1.8 trillion was pandemic emergency funding, a one-time buildup that unwound over the following year. The other elevated readings and sharp declines in 2021, 2022, and 2024 were all debt ceiling related. Upcoming debt ceiling risks pushed the Treasury to build TGA balances. Once Congress acted, the Treasury rapidly spent down the balances.
Today’s high balance breaks that pattern. No debt ceiling crisis preceded this buildup. And the large cash cushion may be drawn down by buying back debt, not by spending it into the economy.
The distinction matters because the funding source for buybacks changes what the intervention actually does. For instance, issuing bills to fund buybacks is a wash for market liquidity. But drawing down the TGA injects cash directly into the banking system. While it’s not QE, because cash, not reserves, is injected into the banking system, it does provide banks with a new source of money to lend.
What To Watch Today
Earnings

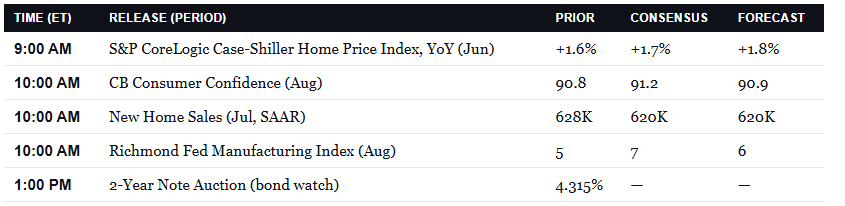
Economy
Fed Speakers
Richmond Fed President Tom Barkin speaks at 8:00 a.m. and 4:00 p.m. ET. The Fed is not in blackout; the week builds to Chair Warsh’s Jackson Hole keynote Friday at 10:00 a.m. ET.
Market Trading Update
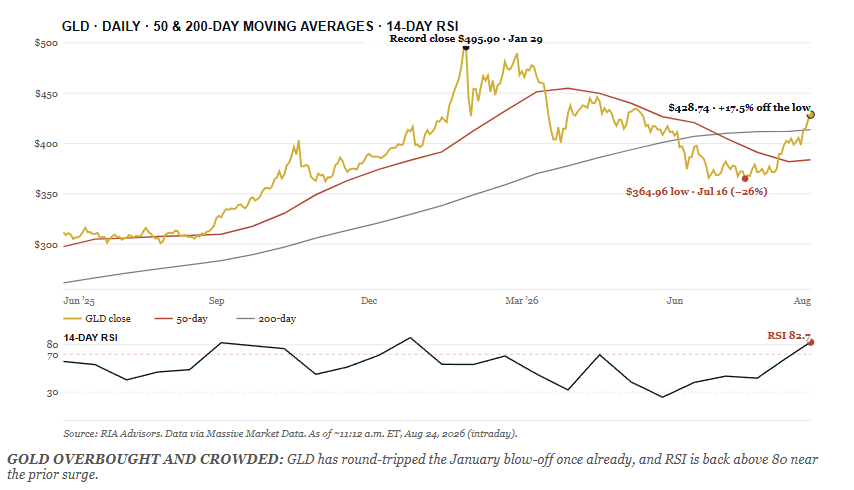
Yesterday, we asked whether Kevin Warsh would talk down the hawks at Jackson Hole. Today I want to turn to the trade that has been front-running that answer. Gold is overbought and crowded again, and this setup rhymes with January in a way worth respecting. As I write on Monday, GLD trades near $428.74, up about 1.3% on the session, with spot gold back above $4,650 an ounce for the first time since mid-May. The move is real, but the question is what is fueling its last leg.
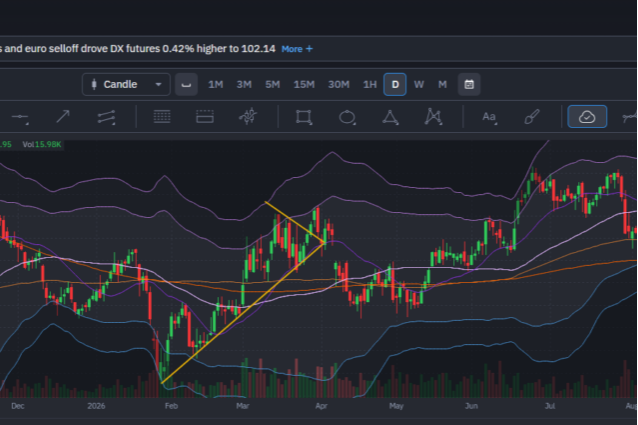
Here is what the tape shows. The 14-day RSI on GLD sits at 82.7, above 80 for a third straight session. That reading is rare, and it tends to show up late in a move, not early. The fund trades 11.7% above its 50-day average near $384 and about 3.6% above its rising 200-day average near $414. Notice in the chart below that the price has already round-tripped once this year. Gold blew off to a record $495.90 close on January 29, surrendered 26% into a $364.96 low by mid-July, then ripped 17.5% off that bottom. It is up more than 15% in August alone, and it still sits roughly 13.5% below the January high.
Positioning tells the same story, only louder. Over the past three weeks, speculators bought a record $22.2 billion in gold futures, the largest notional jump in more than a decade, split between $13.6 billion in fresh longs and $8.6 billion in short covering. Goldman’s (GS) desk data puts net length at the 93rd percentile on a two-year lookback.
The CTAs that were short in early August have flipped hard to long, open interest is climbing with price, and options skew has swung from paying for downside protection to chasing upside calls. The chase is not stopping at gold, either. Bitcoin (BTC.X) is up 23% this month on the very same trade.
None of this breaks the long-term case, with the Treasury doubling its bond buybacks, a softer dollar, and steady central-bank demand are real tailwinds. Furthermore, parabolic moves run further than you think, but they do eventually end. Positioning is stretched, BUT the easy money in this leg is behind us, and Friday’s Warsh keynote is a live trigger for a hawkish jolt that could stall the momentum fast.
So we are managing it, not marrying it. In our All-Weather allocation models, we previously added to exposure, but we are approaching the time to trim tactical gold positions back toward target weights. Tighten trailing stops beneath the rising 50-day, and hold the strategic core that has earned its keep all year. When RSI is 82, positioning sits at the 93rd percentile, and the crowd already agrees, you get paid to take chips off the table, not to add them. We can always buy the pullback. Trade accordingly.
Gold Miners Are Overbought Or Are They?
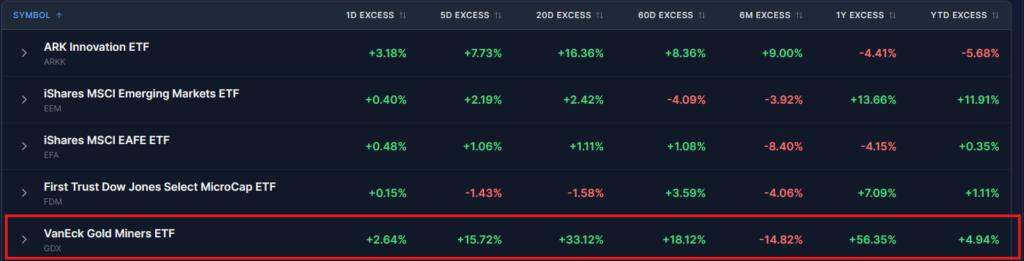
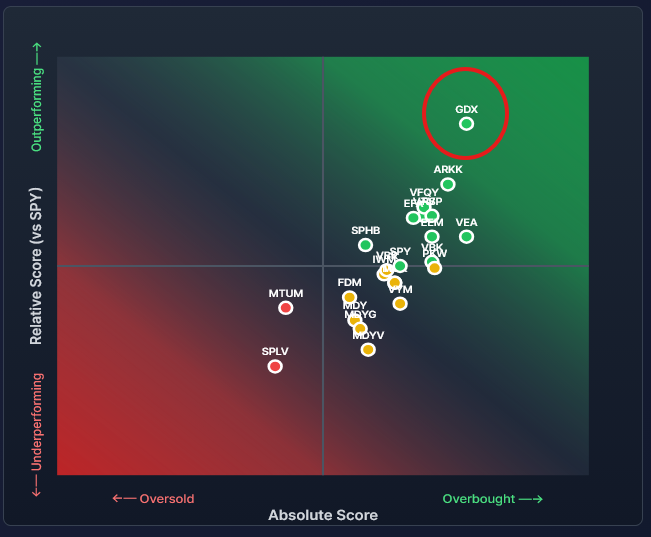
The first table below from the “coming soon” new version of SimpleVisor shows the gold miner ETF GDX has beaten the S&P 500 by 33% over the last 20 trading days. The second graphic shows it is the most overbought factor, both relatively and absolutely. While the rotation and performance signals may suggest gold miners are extended, we must remember that the relative rotation analysis compares GDX’s price to the S&P 500, which isn’t an apples-to-apples comparison. A better way to assess if gold miner stocks are overbought or fair is to compare them to the price of gold.
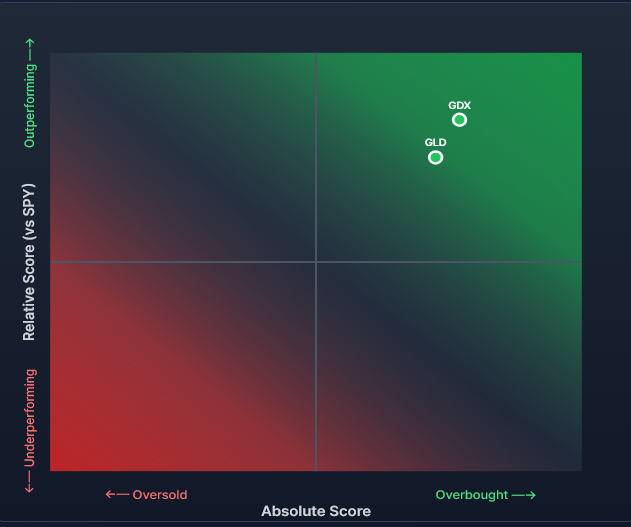
The new version of SimpleVisor will let users create a custom list of stocks and ETFs to analyze together. To highlight this new feature, we did a simple analysis of Gold (GLD) and gold miners (GDX). The two securities are well correlated, as you would expect, but we want to know whether one is outperforming or underperforming the other enough to provide some clues.
The third graphic shows GDX is more overbought than GLD. Both are compared to the S&P 500, but the analysis by default shows how they compare versus each other. While GDX is overbought, the gap between the two scores is not enough to warrant a trade between gold and gold miners. A wider gap may have been a clue to buy one and sell the other.
Investor Psychology Is Sabotaging Your Returns (Part 2)
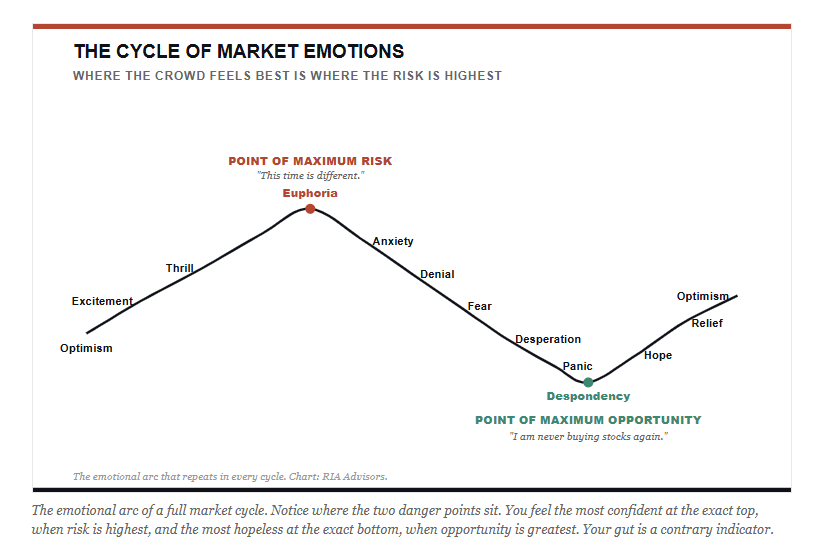
You are human, and humans are built to do exactly the wrong thing at exactly the wrong moment – it is investor psychology
Being human is not a character flaw; it is just our genetic wiring. The same instincts that kept our ancestors alive, like running from danger, following the herd, and vividly remembering the last scary thing, are catastrophic when applied to a brokerage account. Notably, there is a second enemy that is subtler than the first. It is the set of reflexes, our investor psychology, that the market itself has trained into you, year after year, until you mistake them for wisdom. One enemy is how you are built. The second is how you have been trained.
This article is about both. Let’s start with the one in the mirror.
Tweet of the Day
Comments
Log in or sign up to join the conversation.