


Texas Instruments Inc. (TXN) generated strong free cash flow (FCF) and FCF margins on higher revenue in Q2. That implies that TXN stock could be worth 21% to 46% more. Shorting out-of-the-money puts is very attractive to value investors. This article will delve into these points.
TXN closed at $284.99, off 3.13% on Thursday, July 23. That's down 11.6% from a recent peak of $322.28 (June 22). However, over the last 3 months, TXN stock has been more or less flat, as seen in the Barchart chart below.
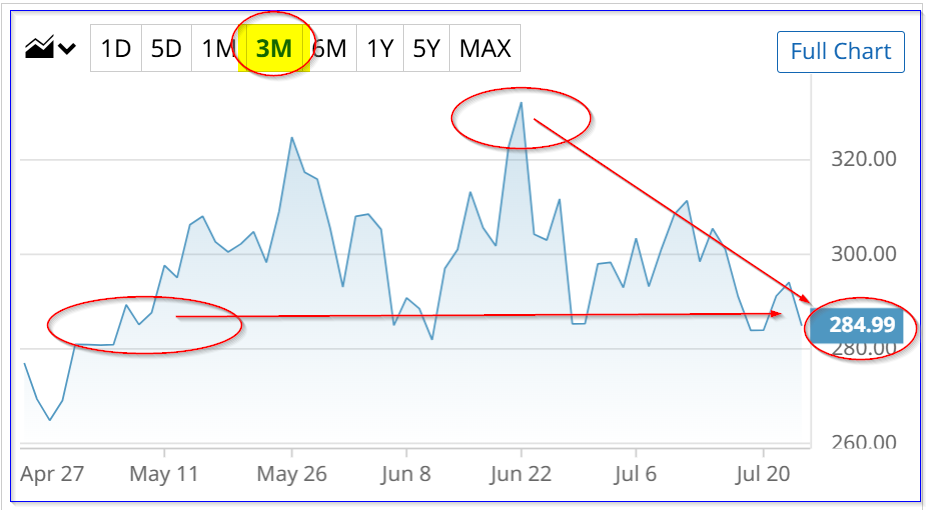
TXN
Strong Results
This was after the July 22 earnings release, which showed that its semiconductor device revenue rose 22.8% YoY and 13.2% over the prior quarter. Its $5.465 billion quarterly revenue was $210 million over analysts' forecasts, or +4.0%, according to Seeking Alpha.
Much of this was due to strong demand from data centers as well as automotive clients. The company also provided a strong outlook for Q3.
Moreover, it generated over $2.738 billion in free cash flow (FCF) in Q2 and $6.53 billion over the past year. These represent 50.1% and 33.6% of revenue, respectively. These are very high and attractive FCF margins to investors.
One reason is that the company has committed to paying out 100% of its FCF to shareholders, either in dividends and/or buybacks.
However, as shown in the table below from page 7 of the Texas Instruments earnings release, these high FCF numbers include payments and tax credits from the U.S. government under the CHIPS Act.
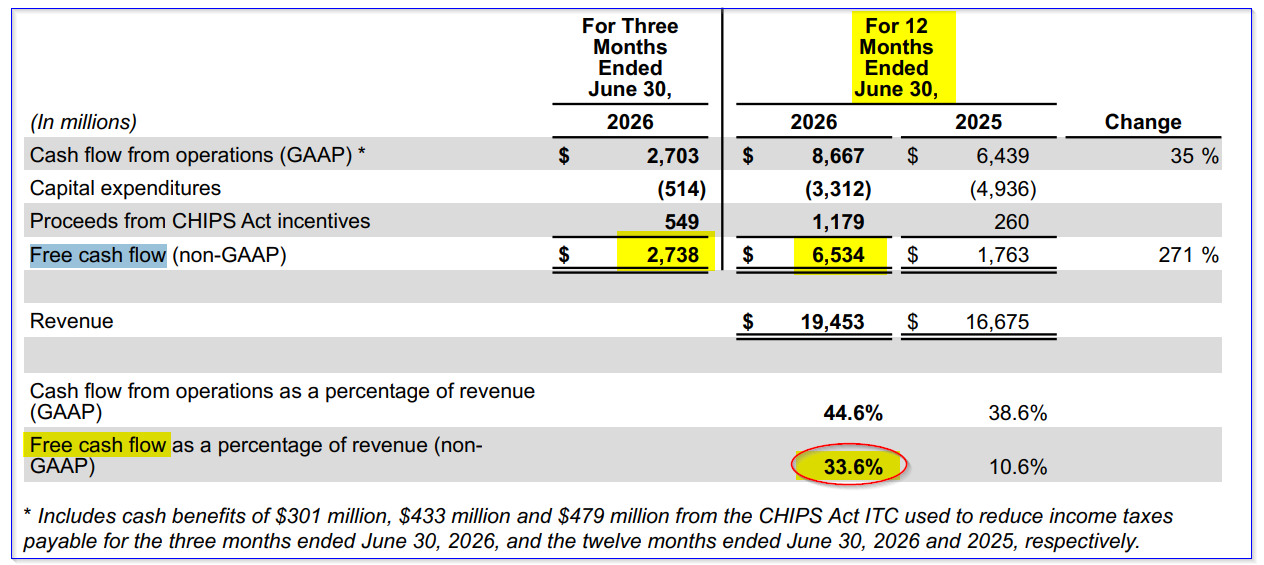
Texas Instruments calculation of FCF for the past 12 months - Q2 (July 22 earnings release)
So, using Stock Analysis data, which excludes these likely one-time or time-limited infusions, the adjusted FCF margins were lower at 40.07% (i.e., $2.189b FCF in Q2), and 27.5% ($5.355 billion TTM).
Forecasting FCF
As a result, analysts can forecast that FCF margins over the next 12 months could range between 27.5% and 40%, or 33.75% on average.
For example, revenue forecasts from 32 analysts now range between $21.87 billion for 2026 and $24.64 billion for 2027. That means the next 12 months (NTM) average is $23.255 billion:
$23.255b x .3375 = $7.85 billion FCF
This roughly matches what the CEO told analysts during the conference call. In response to a question from a Goldman Sachs (GS) analyst about FCF, Haviv Ilan, TXN's CEO, said this (see page 6 of the Q2 conference call transcript):
“So let me just again remind everyone that we gave a framework of revenue and free cash flow. I think the case of revenue, if I think -- if I remember well, at $20 billion, it was $8 to $9. And I think at $22B, it was $9 to $10. So that framework is still valid, Jim. You can use it as you model the company moving forward."
That matches my forecast of almost $8 billion FCF on $23.3 billion in revenue.
The bottom line is that investors can expect at least a 20% increase in FCF (i.e., $7.85b/$6.85b) over the next 12 months.
That could push TXN stock higher.
Price Targets for TXN Based on FCF Yield and from Wall Street Analysts
Here's why. Right now, TXN's market cap is $259.37 billion, according to Yahoo! Finance. That implies, at least theoretically, if Texas Instruments were to pay out 100% of its FCF as a dividend, the yield would be just over 2.0%:
$5.355 billion / $259.378 billion = 0.0206 = 2.06% FCF yield
That is the same as multiplying FCF by 48.5x (i.e., 1/0.0206 = 48.54). Therefore, applying this multiple to our FCF forecast for the next 12 months (NTM):
$7.85b NTM FCF x 48.5 = $380.73 billion fair market value (FMV)
That FMV is +46.8% higher than TXN's present market cap of $259.37 billion.
In other words, the price target (PT) based on FCF yield is $418.36 per share (i.e., $284.99 x 1.468).
Just to be conservative, let's apply a 40x multiple, (i.e., a 2.5% FCF yield). TXN's FMV would be $314 billion (i.e., $7.85b x 40). That is 21% higher than today's market cap, implying a PT of $344.84 per share (i.e., 1.21 x $284.99).
Wall Street analysts agree TXN is undervalued. The average PT from Yahoo! Finance's survey is $307.58, Barchart's mean survey PT is $305.89, and AnaChart's survey of 25 analysts is $284.50. So, the average of all three is $299.32. That is 5% over Thursday's close.
However, there is no guarantee TXN will rise to my higher PT. As a result, value investors are more interested in shorting out-of-the-money (OTM) puts.
Shorting TXN Puts
For example, the August 28 expiry period, a little over one month from now, shows that the $260.00 put strike price, which is 8.5% lower, has a midpoint premium of $9.53.
That provides a TXN put short seller a one-month yield of 3.665% (i.e., $9.53/$260.00).
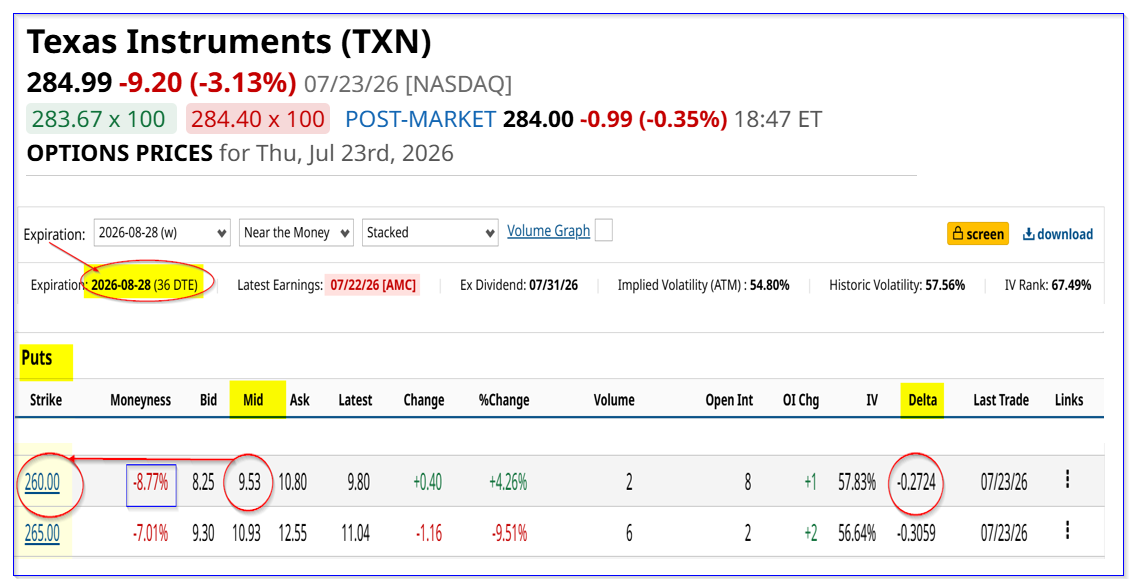
TXN puts expiring Aug. 28 - Barchart - As of July 22, 2026
This means that an investor who posts $26,000 with their brokerage firm can enter a trade order to “Sell to Open” 1 put at $260.00. The account will then receive $953 (i.e., $9.53 x 100 shares per put contract). That is 3.665% of the $26K collateral.
Even if TXN drops to $260.00 from $284.99, the investor's only obligation is to buy 100 shares at $260. That's why there is $26,000 in collateral posted. But the breakeven price is lower, since the investor already received the $953.00:
$26,000 - $953.00 = $25,047 breakeven cost
That's equal to $250.47 per share, or 12.1% below Thursday's close (July 22).
Moreover, if the investor can repeat this play over the next 6 months, the expected return (ER) is 22% (i.e., 3.665% x 6 = 0.2199). That's over my lower PT return from buying and holding TXN above.
The bottom line is that shorting OTM puts is an attractive way to set a lower TXN buy-in point and also get paid while waiting.



Comments
Log in or sign up to join the conversation.