
A picture is worth a thousand words.
(Click on image to enlarge)
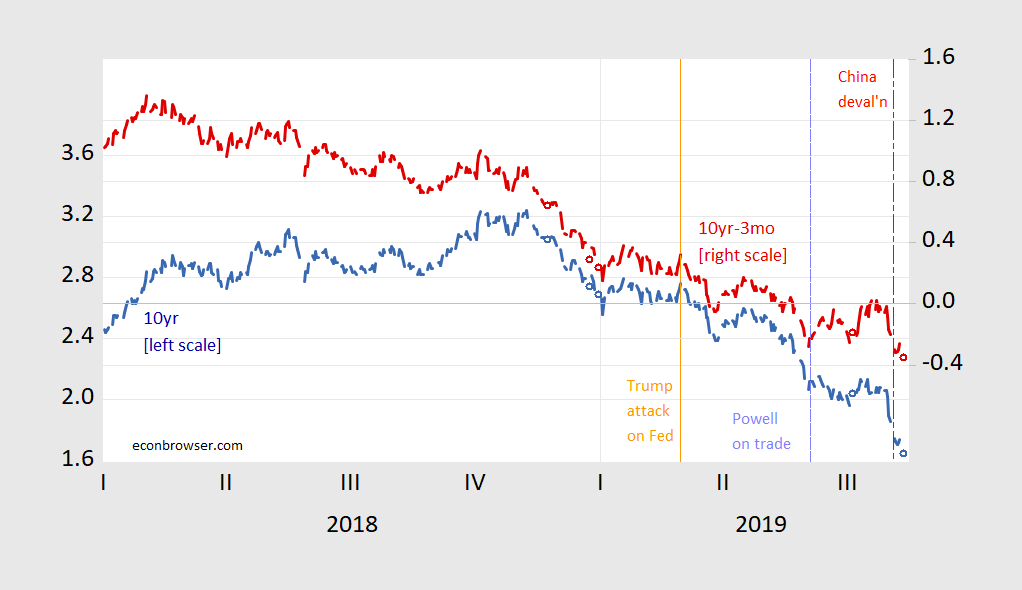
Figure 1: Treasury ten year constant maturity yield, % (blue, left scale), 10yr-3mo spread, % (red, right scale). Source: Federal Reserve via FRED, Treasury, and author’s calculations.
Winning!


Comments
Log in or sign up to join the conversation.