
There’s been a lot of commentary regarding the inversion of the US yield curve, specifically a negative 10yr-2yr spread. Here’s a graph depicting 10yr-2yr spreads (2s10s) for several economies.
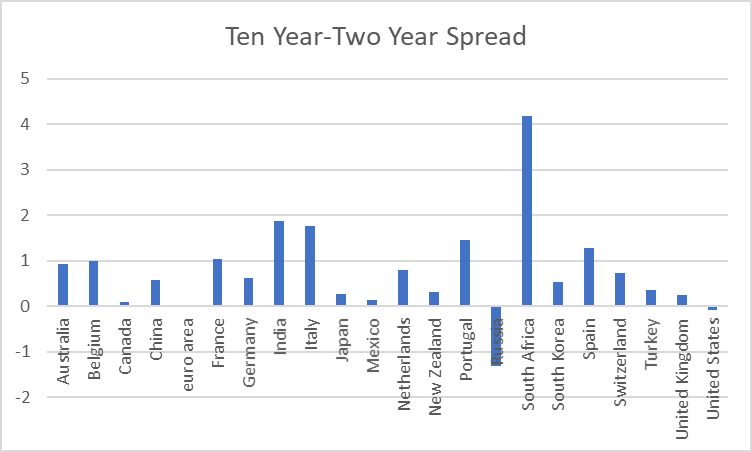
Figure 1: Ten year minus two year spreads as of 4/1/2022, %. Source: WorldGovernmentBonds.com, accessed 4/2/2022.
Note that there is little cross-country research on the predictive power of this spread for recessions. Chinn & Kucko (2015) analyzes 10yr-3mo, Mehl (2014) investigates 5yr-3mo for emerging markets. Haubrich (2021) [ungated 2020 wp version] reviews some of the more recent cross-country evidence.
The Economist used to report the 10 year and 3 month rates in easy form, but stopped a while back. TradingEconomics.com reports 10 year and policy rates. Here’s a figure comparable to Figure 1.
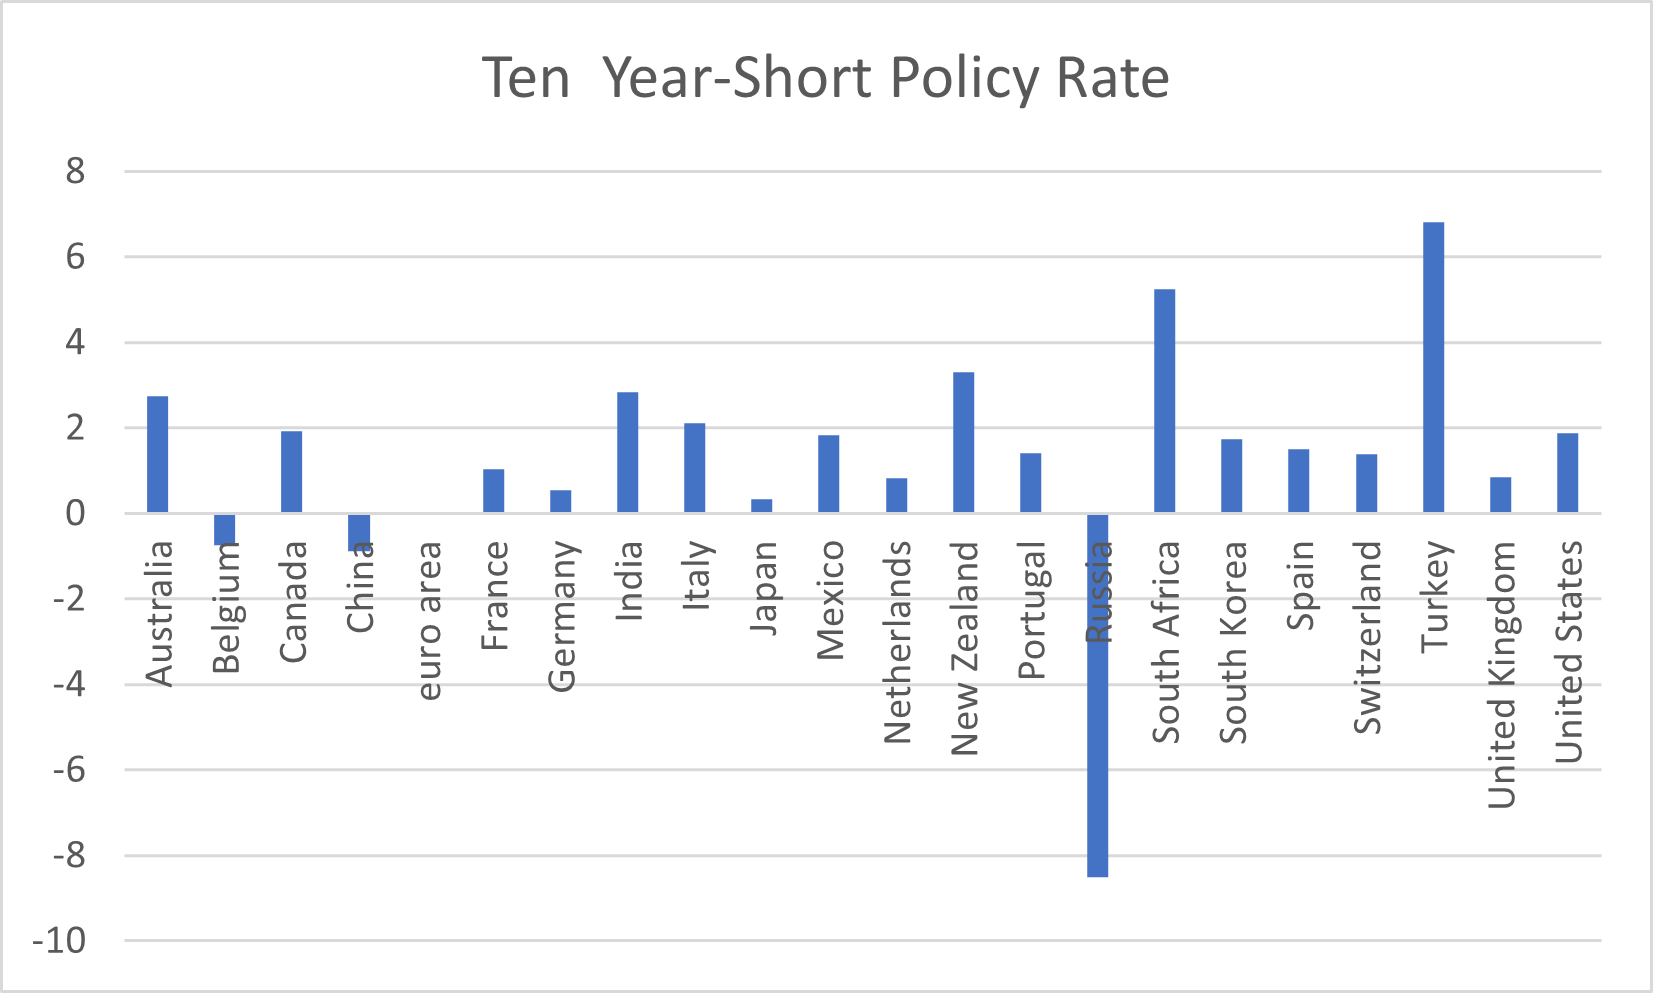
Figure 2: Ten year minus policy rate spreads as of 4/1/2022, %. Source: TradingEconomics.com, accessed 4/2/2022, and author’s calculations.
What to make of these developments? Here is a graph of recession probabilities for the United States from the 10yr-2yr and 10yr-Fed funds (blue, teal, respectively) and for comparison, 10yr-3mo (red). This is suggestive that we might not want to pay too much attention to the 2s10s (even if such inversions have preceded all the recessions for which we have data).
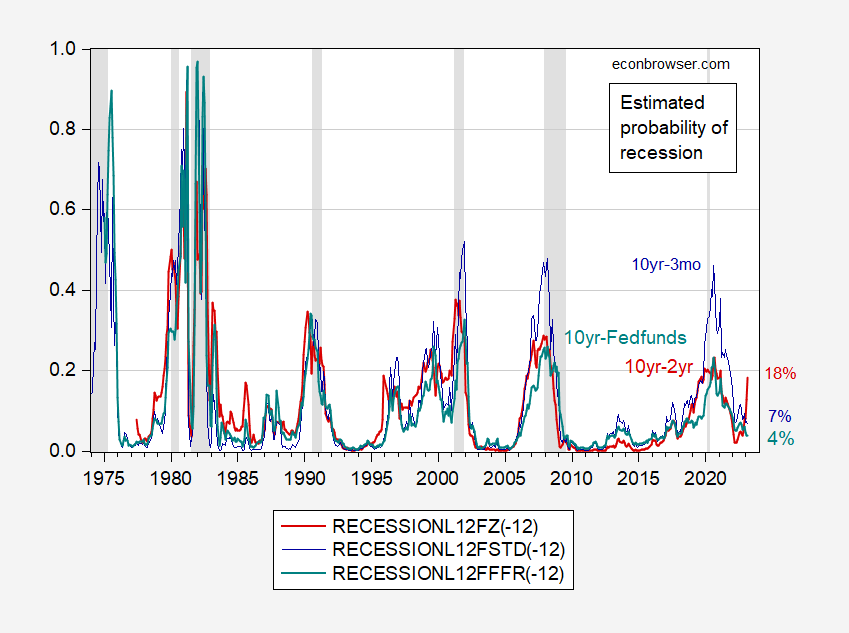
Figure 3: 12 month ahead estimated probability of recession using 10yr-3mo Treasury spread (blue), using 10yr-2yr spread (red), using 10yr-Fed funds (real). NBER defined recession dates peak-to-trough shaded gray. Source: Treasury via FRED, NBER and author’s calculations.


Comments
Log in or sign up to join the conversation.