


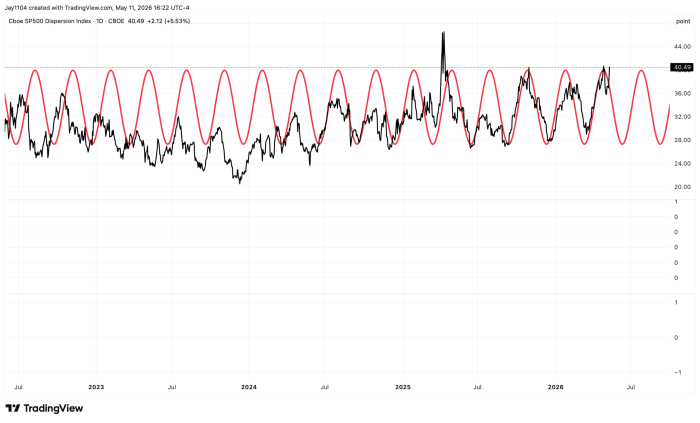
Stocks finished the day mostly flat, with the S&P 500 (SPX) up less than 20 basis points and the RSP down fractionally. However, this pushed dispersion in the index even higher. The Dispersion Index closed the day near 40.5, above its level prior to the mega-cap earnings reports, which is something I have not seen in recent memory.
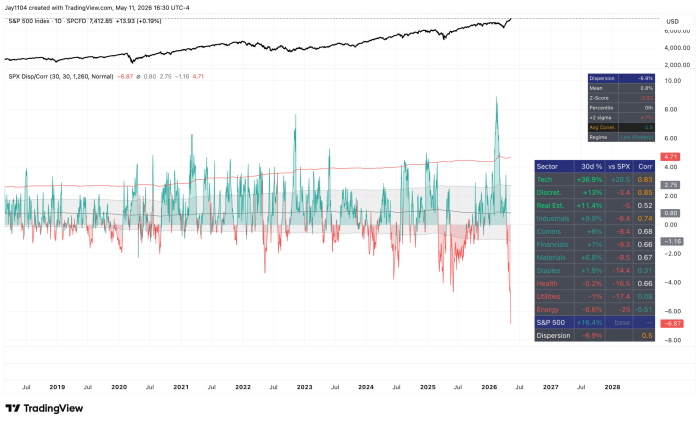
The move continues to be all about technology, with the XLK ETF outperforming the S&P 500 by 20.5 percentage points over the past 30 days. Meanwhile, every other major sector has underperformed the index over the same period.
On a five-year lookback, the gap between the SPX’s move and the average sector’s move is now in the 0th percentile. Just to make that clear: the zero percentile. The S&P 500 is up 16.4% over the past 30 days, but the average sector has only moved 9.5%. That gap has never been wider in five years. Tech is roughly 30% of the index and up nearly 37% — it alone is doing about two-thirds of the SPX’s move. Strip it out, and the rest of the market looks far weaker than the headline suggests.
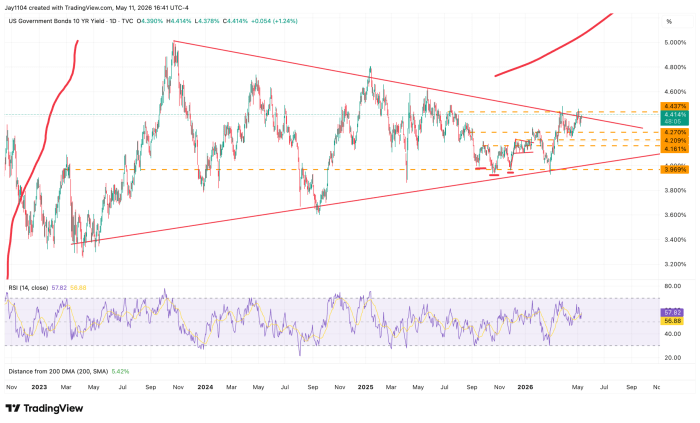
The 10-year managed to push just barely above the downtrend today, although it was not the cleanest breakout one would want to see. Breaking out through a period of consolidation is not ideal and, in many cases, is not really a breakout at all.
In theory, for the 10-year to begin moving meaningfully higher from here, it likely needs to break above 4.45% and do so fairly quickly.
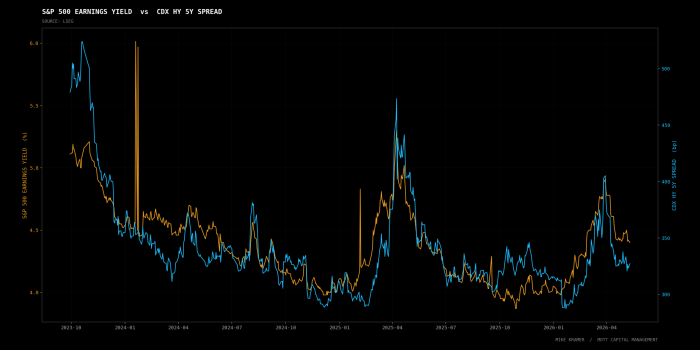
High-yield credit spreads have notably turned higher over the past couple of days, while the S&P 500 earnings yield has moved lower. That is a divergence worth watching because one of them is likely wrong. Given where dispersion is and how much technology has outperformed the broader S&P 500, my guess is that the S&P 500 is the one that is wrong.
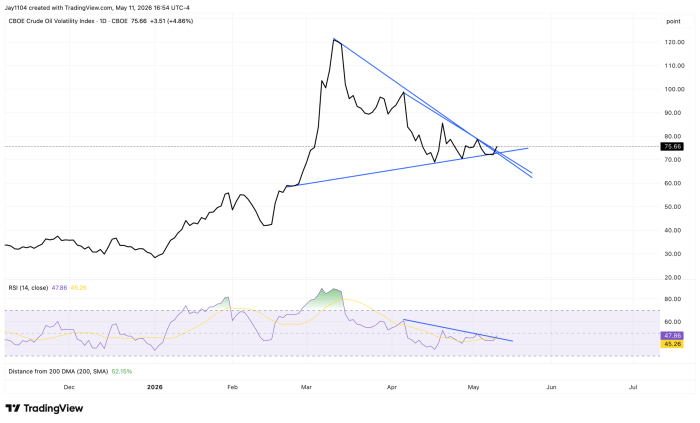
Finally, the oil volatility index (OVX) rose today and broke above two downtrend lines. If the OVX truly breaks out and continues higher from here, the party may be over.
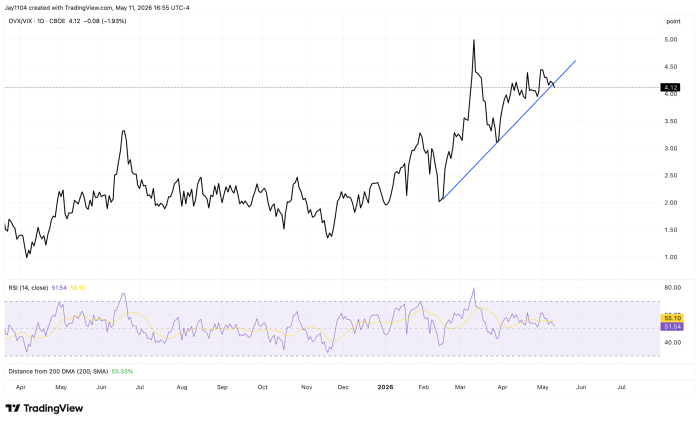
In the meantime, the OVX-to-VIX ratio also broke below an uptrend line, which is certainly something worth watching.


Comments
Log in or sign up to join the conversation.