

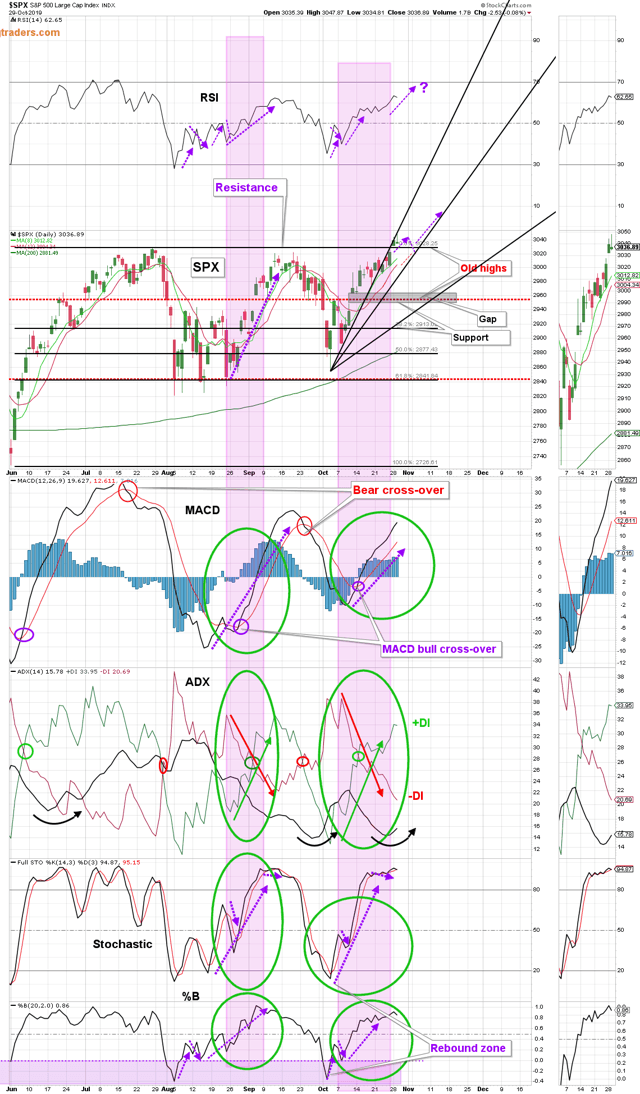
Technically, the SPX has been moving as we suggested in the Weekly Summary; moved to new highs, but is likely to fall back as the momentum indicators become over-extended (chart below).
(Click on image to enlarge)
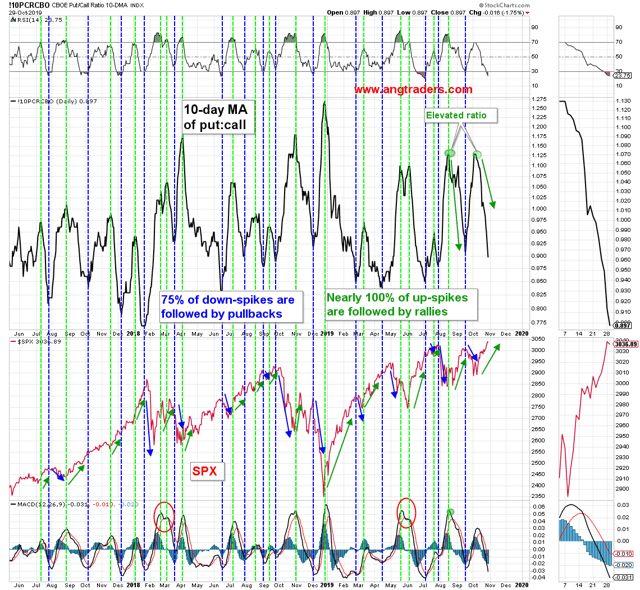
The 10-day MA of the put:call ratio continues to descend (bullish), but like the momentum indicators, it is getting over-extended and could turn around soon (chart below).
(Click on image to enlarge)
During the 2018 correction, our analysis showed that we were not at the start of a new bear market and that the bull market was not in the process of ending. As a result, our subscribers avoided the herd mentality of panicked-selling and the losses it created. We continue to monitor the Treasury cash balance and investor sentiment as the key indicators of the future.



Comments
Log in or sign up to join the conversation.