
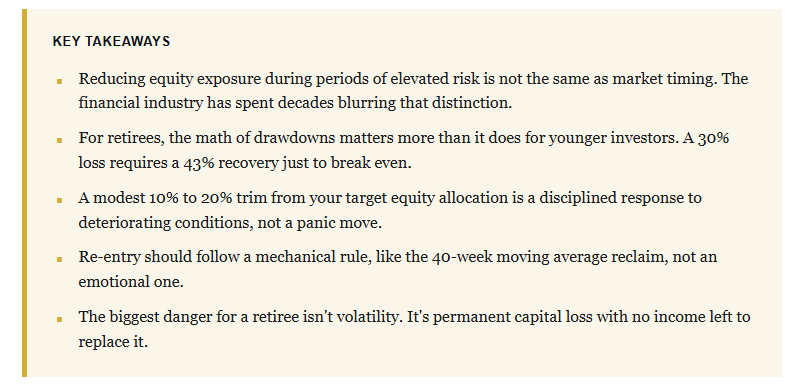
As I suggested on Friday, the oversold condition of the market led to an expected short-term rally. To wit:
"Any rally that occurs over the next few days from the current oversold condition should be used as a 'sellable rally' to rebalance portfolios and related risk."
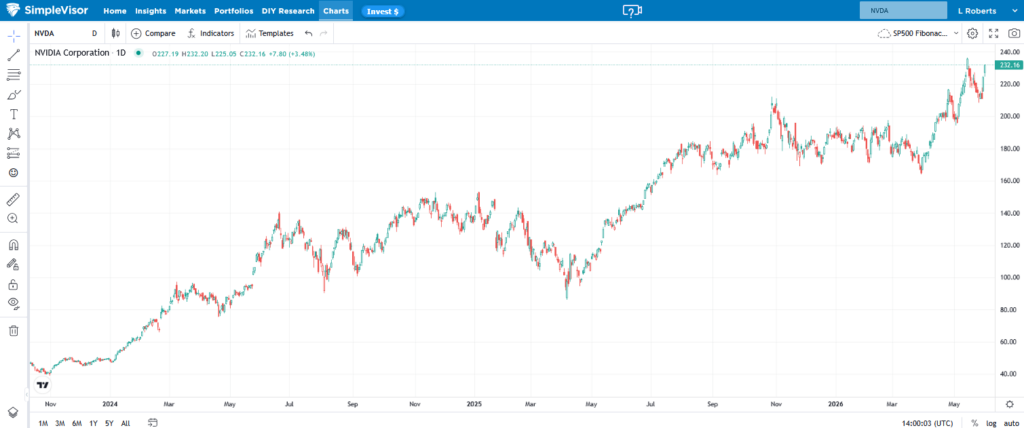
Yesterday, the markets sprung to life with a sharp rally as all major indices gained more than 1% for the day as "shorts" were forced to cover. As shown in the chart below, the markets had recently gotten back to an "oversold" condition at the primary support of the 200-day moving average (DMA). Since December of 2012, when then-Fed Chairman Ben Bernanke launched QE3, the 150-dma acted as critical support for the seemingly relentless bull run. However, as of late, the 150-dma has lost traction but was replaced by rather staunch support at the 200-dma.
Click on picture to enlarge

However, on a closer examination, we can see the change in the complexion of the market over the last couple of months as momentum has begun to wane.
On a daily basis, it has become clear that market prices have changed from a positive to a negative slope. The previous consolidation was in a narrowing uptrend, whereas currently price action has broadened out in a sloping downtrend. This comfirms that there is an overall negative bias to prices currently.
Click on picture to enlarge

As shown, the market has yet to break decisively above the downtrend line that began in May of this year. While the market is currently bouncing from the oversold condition from last week's decline, the rally on Monday used up a significant chunk of that "fuel"as shown by the bottom part of the chart.
Importantly, if the market moves back into an OVERBOUGHT condition WITHOUT making new all-time highs, investors should use such a failure to reduce portfolio risk in the short-term. The failure of the markets to reconfirm the bullish trend continues to elevate the potential risk of a deeper correction in the short-term.
On a longer-term analysis, the bullish deterioration becomes even more evident. If we smooth market volatility with weekly data, we can obtain a clearer picture of overall market trends and price action.
Click on picture to enlarge

As shown, beginning in 2012, the bull market run has maintained support at the bullish trend (effectively the 200-dma). Each decline to that support has provided investors with an opportunity to obtain exposure the market.
Notice the deviation in price in 2013-2014 from the bullish trend support. There was a significant degree of room for prices to fall without violating the bullish trend.Currently, that is no longer the case.
This is crucially important to understand. As I have discussed previously, you are a"SAVER," not an "INVESTOR."
"Unlike Warren Buffet who takes control of a company and can affect its financial direction - you are speculating that a purchase of a share of stock today can be sold at a higher price in the future. Furthermore, you are doing this with your hard earned savings. If you ask most people if they would bet their retirement savings on a hand of poker in Vegas they would tell you "no."When asked why, they will say they don't have the skill to be successful at winning at poker. However, on a daily basis these same individuals will buy shares of a company in which they have no knowledge of operations, revenue, profitability, or future viability simply because someone on television told them to do so.
Keeping the right frame of mind about the "risk" that is undertaken in a portfolio can help stem the tide of loss when things inevitably go wrong. Like any professional gambler - the secret to long-term success was best sung by Kenny Rogers; 'You gotta know when to hold'em...know when to fold'em.'"
Over the last few years, investors have become complacent at the "betting table" as the market has consistently dealth a "hot hand." However, as any professional gambler knows, when the "deck turns cold" it is time to leave the table and protect their"winnings."
It recent weeks, as shown in the chart above, the market has indeed turned cold. The recent compression of prices between the declining tops of rallies and rising levels of support is similar to the compression of a "spring." The tighter the spring is coiled, the greater the expansion will be when it is released.
Currently, the ongoing battle between the bulls and bears has yet to be resolved. However, I suspect that a victor will be declared soon. As shown in the chart below, by analyzing the longer-term trend of the market we can make an assumption of the potential magnitude of the price move when the current compression is resolved.
Click on picture to enlarge

If the "bulls" are declared the victor, a run to 2300 from current levels would not be surprising. This would be a roughly 9% gain by year-end and would return the market to the top of the bullish trend channel that has evolved following the 2011 market decline.
However, a defeat of the "bulls" would see a potential retest near the October 2014 lows. The current bullish trend support should be around 1900 by the end of 2015 with the October 2014 lows as support just below. This would entail a roughly 10-12% decline from current levels.
You should recognize that a potential 9% gain is outweighed by the potential for a 10-12% decline. With the risk/reward ratio negative, investors should err to the side of caution currently. (I.E. there is more to lose than potentially gain from being aggressively invested currently.)
With the internals of the market continuing to show signs of deterioration, a realization that the economy is on fairly weak footing, and the potential of a China mishap; the risk to the market currently is to the downside. However, the market will soon make its decision and investors would be wise to react accordingly.
As I stated in this past weekend's missive:
"It's time to pay attention; things are about to get very interesting."

Lance Roberts

Comments
Log in or sign up to join the conversation.