


The good news is:
- Last week the market commenced its run for the roses.
The Negatives
The market is short term overbought. All of the major indices were up over 2% in the shortened week.
The first chart covers the past 6 months showing the Nasdaq composite (OTC) in blue and a 10% trend (19 day EMA) of NASDAQ new highs (OTC NH) in green. Dashed vertical lines have been drawn on the 1st trading day of each month.
The index is likely to hit a new all time high in the next few weeks and that new high is unlikely to be confirmed by OTC NH.

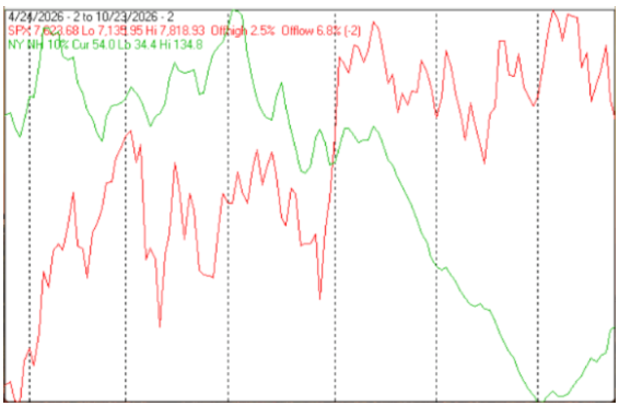
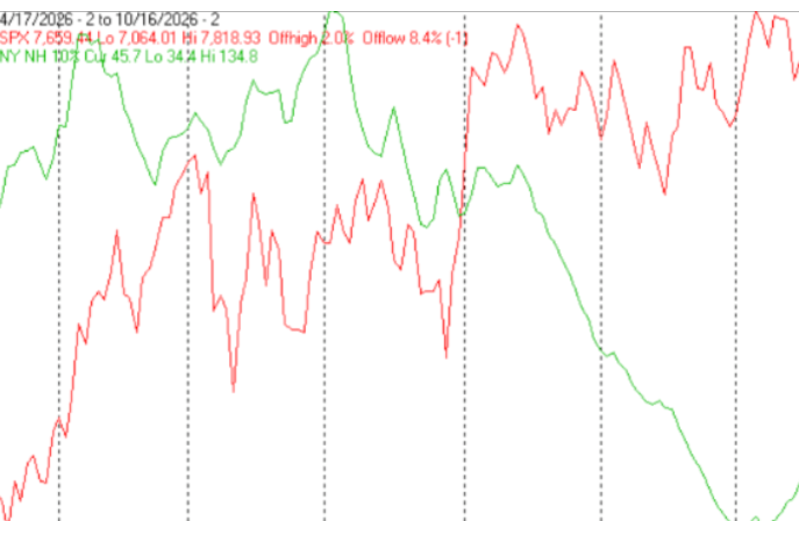
The next chart is similar to the first one except it shows the S&P 500 (SPX) in red and NY NH, in green, has been calculated with NYSE data.
Ditto NY NH.

The Positives
The breadth indicators are suggesting the early October index lows were a short term bottom.
The next chart covers the past 6 months showing the OTC in blue and a 10% trend (19 day EMA) of NASDAQ new lows (OTC NL), in brown. OTC NL has been plotted on an inverted Y axis so decreasing numbers of new lows move the indicator upward (up is good).
OTC NL moved sharply upward last week. The early October index low was lower than the mid August index low while the early October OTC NL low was higher than the mid August OTC NL low. This is a classic non confirmation.

The next chart is similar to the one above except is shows the SPX in red and NY NL has been calculated with NYSE data.
The NY NL / SPX pattern is similar to the above chart, but not as clear because the NY NL lows were roughly equivalent.

The next chart covers the past 6 months showing the OTC in blue and a 40% trend (4 day EMA) of NASDAQ new highs divided by new highs + new lows (OTC HL Ratio), in red. Dashed horizontal lines have been drawn at 10% levels for the indicator; the line is solid at the 50%, neutral level.
OTC HL Ratio recovered to positive territory.

The next chart is similar to the previous one except it shows the SPX in red and NY HL ratio, in blue, has been calculated with NYSE data.
NY HL Ratio moved sharply higher finishing the week at a comfortable 79%.

Seasonality
Next week includes the 5 trading days prior to the 4th Friday of October during the 1st year of the Presidential Cycle. The tables below show the daily change, on a percentage basis, for that period.
OTC data covers the period from 1963 to 2020 while SPX data runs from 1953 to 2020. There are summaries for both the 1st year of the Presidential Cycle and all years combined. Prior to 1953 the market traded 6 days a week so that data has been ignored.
Average returns for the coming week have been mixed and stronger during the 1st year of the Presidential Cycle than other years,
Report for the week before the 4th Friday of October.

The number following the year is the position in the Presidential Cycle.

Daily returns from Monday through the 4th Friday.

OTC Presidential Year 1 (PY1)

 Year       Mon     Tue     Wed    Thur    Fri    Totals

 1965-1   0.41%   0.13%  -0.15%   0.29%   0.16%   0.85%

 1969-1   1.07%   0.34%   0.73%   2.26%   0.86%   5.26%

 1973-1  -0.85%  -0.43%   0.29%   0.16%   0.43%  -0.40%

 1977-1  -0.66%  -1.08%   0.03%   0.22%   0.43%  -1.06%


 1981-1  -0.25%   0.77%   0.60%   0.03%  -0.27%   0.88%

 1985-1  -0.23%   0.29%   0.27%   0.44%  -0.38%   0.39%

 1989-1  -0.73%  -1.18%   0.26%  -1.02%  -1.18%  -3.86%

 1993-1  -0.57%  -1.81%  -0.06%   0.39%   0.18%  -1.87%

 1997-1   1.12%   1.78%  -0.43%  -2.15%  -1.22%  -0.91%


 Avg     -0.13%  -0.03%   0.13%  -0.46%  -0.57%  -1.07%


 2001-1   2.20%  -0.21%   1.59%   2.54%  -0.37%   5.75%

 2005-1   1.61%  -0.30%  -0.45%  -1.73%   1.26%   0.41%

 2009-1   0.91%  -0.59%  -0.59%   0.68%  -0.50%  -0.10%

 2013-1   0.15%   0.24%  -0.57%   0.56%   0.37%   0.74%

 2017-1  -0.63%   0.18%  -0.52%  -0.11%   2.19%   1.11%


 Avg      0.85%  -0.14%  -0.11%   0.39%   0.59%   1.58%


OTC summary for PY1 1965 - 2017

 Avg      0.25%  -0.13%   0.07%   0.18%   0.14%   0.51%

 Win%       50%     50%     50%     71%     57%     57%


OTC summary for all years 1963 - 2020

 Avg      0.08%  -0.43%  -0.01%   0.05%  -0.04%  -0.35%

 Win%       53%     38%     51%     53%     55%     50%


SPX PY1

 Year       Mon     Tue     Wed    Thur    Fri    Totals

 1953-1   0.08%   0.04%   0.08%   0.45%   0.21%   0.87%

 1957-1  -2.93%  -0.43%   4.49%  -0.05%  -0.29%   0.79%


 1961-1  -0.61%  -0.12%   0.53%   0.18%  -0.18%  -0.20%

 1965-1   0.33%   0.13%  -0.02%   0.17%   0.04%   0.66%

 1969-1   0.21%   0.77%   0.65%  -0.38%   0.68%   1.92%

 1973-1  -0.96%   0.54%   0.47%   0.21%   0.80%   1.06%

 1977-1  -0.75%  -0.69%   1.21%   0.26%   0.29%   0.33%


 Avg     -0.36%   0.13%   0.57%   0.09%   0.33%   0.75%


 1981-1  -0.18%   1.09%  -0.15%  -0.38%  -0.87%  -0.49%

 1985-1  -0.04%   0.58%   0.56%  -0.31%  -0.52%   0.26%

 1989-1  -0.67%  -0.33%  -0.35%  -1.33%  -0.85%  -3.53%

 1993-1  -0.22%  -0.48%  -0.03%  -0.15%  -0.45%  -1.33%

 1997-1   1.21%   1.75%  -0.39%  -1.84%  -0.95%  -0.22%


 Avg      0.02%   0.52%  -0.07%  -0.80%  -0.73%  -1.06%


 2001-1   1.53%  -0.47%   0.04%   1.37%   0.41%   2.88%

 2005-1   1.68%  -0.24%  -0.43%  -1.05%   1.65%   1.62%

 2009-1   0.94%  -0.62%  -0.89%   1.06%  -1.22%  -0.72%

 2013-1   0.01%   0.57%  -0.47%   0.33%   0.44%   0.88%

 2017-1  -0.40%   0.16%  -0.47%   0.13%   0.81%   0.23%


 Avg      0.75%  -0.12%  -0.44%   0.37%   0.42%   0.98%


SPX summary for PY1 1953 - 2017

 Avg     -0.05%   0.13%   0.28%  -0.08%   0.00%   0.29%

 Win%       47%     53%     47%     53%     53%     65%


SPX summary for all years 1953 - 2020

 Avg     -0.13%  -0.10%   0.10%  -0.08%  -0.03%  -0.24%

 Win%       57%     43%     54%     44%     49%     47%
Money supply (M2) and Interest Rates
The following charts were supplied by Gordon Harms.
M2 growth continued to level off. Perhaps the Fed has quit calculating M2.

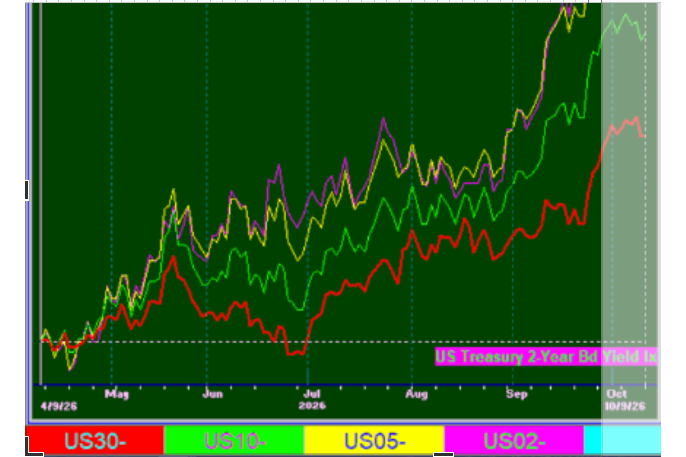
Treasury rates at their close last Friday and their changes from last month:
- 2yr yield 0.395% up from 0.222%
- 5yr yield 1.126% up from 0.860%
- 10yr yield 1.575% up from 1.371%
- 30yr yield 2.042% up from 1.906%
All rates rose in the past month.

The next chart is a close up showing just the past year from the chart above.

Conclusion
Equities took off last week suggesting the move to a final cycle top has begun.
The strongest sectors last week were Precious Metals and Basic Materials while the weakest were Biotech and Leisure.
I expect the major averages to be higher on Friday October 22 than they were on Friday October 15.
Comments
Log in or sign up to join the conversation.