
Technical Market Report for Saturday, July 3, 2021
The good news is that the NASDAQ composite (OTC), S&P 500 (SPX), and Dow Jones Industrial Average (DJIA) all closed at all-time highs last Friday.
The Negatives
New highs continued to deteriorate, thus indicating narrowing leadership, while index prices hit new highs. The first chart covers the past six months, showing the OTC in blue and a 10% trend (19-day EMA) of NASDAQ new highs (OTC NH) in green. Dashed vertical lines have been drawn on the first trading day of each month. The OTC NH failed to confirm the all-time index high by a wide margin.

The next chart is similar to the first one, except it shows the SPX in red and the NY NH in green. The information has been calculated with NYSE data. Similar action was seen in the NY NH and SPX.

Although the new high indicators are near their six-month lows, their actual values are high enough to imply higher blue chip highs lie ahead.
The Positives
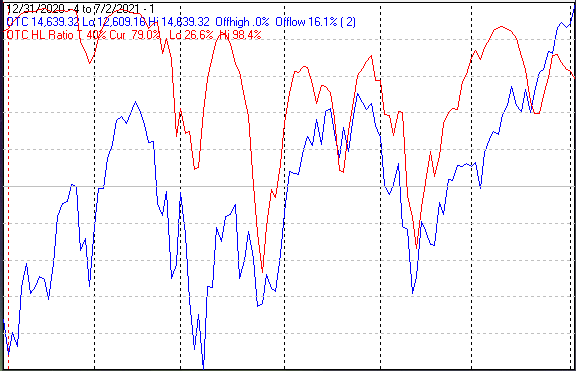
The number of new lows remained non-threatening this past week. The next chart covers the past six months, showing the OTC in blue, and a 40% trend (four-day EMA) of NASDAQ new highs divided by new highs + new lows (OTC HL Ratio) in red. Dashed horizontal lines have been drawn at 10% levels for the indicator; the line is solid at the 50%, neutral level.
The OTC HL Ratio finished the week at a strong 79%.
The next chart is similar to the one above, except it shows the SPX in red and the NY HL ratio in blue. The information has been calculated with NYSE data. The NY HL Ratio finished the week at a very strong 94%.

The high-low ratio indicators are not predictive, but provide a good indication of current breadth conditions. The first two charts show weakness in the number of new highs, yet the minimal number of new lows does generate high values for the ratio indicators.
Seasonality
Next week includes the five trading days prior to the second Friday of July during the first year of the Presidential Cycle. The tables below show the daily change on a percentage basis for that period.
OTC data covers the period from 1963 to 2020, while SPX data runs from 1953 to 2020. There are summaries for both the first year of the Presidential Cycle and all years combined. Prior to 1953 the market traded six days a week, so that data has been ignored.
Average returns for the coming week have been positive by all measures. The number following the year is the position in the Presidential Cycle.
OTC Presidential Year 1 (PY1)
Year Mon Tue Wed Thur Fri Totals
1965-1 0.00% 0.82% -0.28% -0.06% 0.83% 1.31%
1969-1 -0.01% -0.87% -0.44% 0.37% 0.79% -0.15%
1973-1 0.53% 1.17% 1.49% 0.47% -0.14% 3.53%
1977-1 0.00% 0.22% -0.16% 0.32% 0.53% 0.91%
1981-1 0.15% -0.46% 0.46% 0.56% 0.35% 1.05%
1985-1 -0.26% -0.22% 0.46% 0.67% 0.62% 1.27%
1989-1 0.06% 0.41% 0.52% 0.24% 0.23% 1.46%
1993-1 0.00% -0.32% -0.49% 0.56% 0.44% 0.19%
1997-1 1.42% 1.19% 2.50% -0.74% -1.33% 3.04%
Avg: 0.34% 0.12% 0.69% 0.26% 0.06% 1.40%
2001-1 1.13% -3.15% 0.47% 5.26% 0.44% 4.14%
2005-1 0.00% 1.04% -0.49% 0.34% 1.79% 2.69%
2009-1 2.12% 0.36% 3.51% 1.19% 0.08% 7.26%
2013-1 0.16% 0.56% 0.47% 1.63% 0.61% 3.43%
2017-1 0.38% 0.27% 1.09% 0.21% 0.60% 2.55%
Avg: 0.94% -0.18% 1.01% 1.73% 0.70% 4.01%
OTC Summary for PY1 1965 - 2017
- Avg: 0.57% 0.07% 0.65% 0.79% 0.42% 2.33%
- Win%: 80% 64% 64% 86% 86% 93%
OTC Summary for All Years 1963 - 2020
- Avg: 0.04% -0.08% 0.36% 0.30% 0.44% 1.04%
- Win%: 67% 53% 61% 66% 78% 69%
SPX PY1
Year Mon Tue Wed Thur Fri Totals
1953-1 0.08% 0.53% -0.04% -0.29% -0.08% 0.21%
1957-1 0.43% -0.37% 0.68% -0.39% 0.45% 0.80%
1961-1 -0.09% -0.03% -0.56% -0.70% 0.65% -0.74%
1965-1 0.00% -0.20% -0.38% 0.85% 0.37% 0.65%
1969-1 -1.27% -0.33% 1.00% 0.61% -0.85% -0.84%
1973-1 0.85% 1.35% 2.20% -0.28% -1.34% 2.78%
1977-1 0.00% -0.01% -0.51% 0.35% -0.14% -0.31%
Avg: -0.17% 0.16% 0.35% 0.16% -0.26% 0.31%
1981-1 0.21% 0.01% 0.46% 0.07% 0.32% 1.07%
1985-1 -0.31% -0.46% 0.69% 0.30% 0.18% 0.40%
1989-1 0.65% 0.54% 0.31% 0.04% 0.57% 2.12%
1993-1 0.00% -0.99% 0.32% 1.31% -0.11% 0.53%
1997-1 0.19% 0.80% 1.17% -0.53% -1.75% -0.12%
Avg: 0.18% -0.02% 0.59% 0.24% -0.16% 0.80%
2001-1 0.69% -1.44% -0.11% 2.37% 0.62% 2.13%
2005-1 0.00% 0.88% -0.83% 0.25% 1.17% 1.46%
2009-1 2.49% 0.53% 2.96% 0.86% -0.04% 6.81%
2013-1 0.53% 0.72% 0.02% 1.36% 0.31% 2.93%
2017-1 0.09% -0.08% 0.73% 0.19% 0.47% 1.40%
Avg: 0.95% 0.12% 0.55% 1.00% 0.51% 2.95%
SPX Summary for PY1 1953 - 2017
- Avg: 0.35% 0.09% 0.48% 0.37% 0.05% 1.25%
- Win%: 77% 47% 65% 71% 59% 76%
SPX Summary for All Years 1963 - 2020
- Avg: 0.04% -0.01% 0.27% 0.17% 0.31% 0.77%
- Win%: 59% 47% 60% 61% 71% 71%
Conclusion
The relatively low number of new 52-week highs indicates a narrowing of leadership. This can go on for a long time as long as new lows remain minimal. The strongest sectors last week were technology and retail, while the weakest were energy services and banks.
I expect the major averages to be higher on Friday, July 9 than they were on Friday, July 2. The SPX, OTC, and DJIA all closed at all-time highs last Friday, but the Russell 2000 was down for the week. So I am calling last week's positive forecast a tie.


Comments
Log in or sign up to join the conversation.