

Technical market report for November 21, 2026
The good news is:
Losses like we saw last week cannot go on for very long.
The Negatives
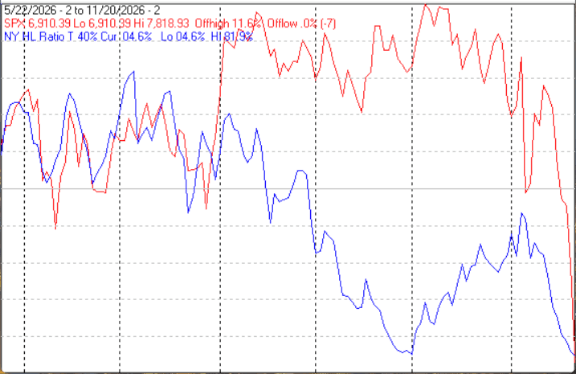
The first chart covers the past 6 months showing the S&P 500 (SPX) in red and a 40% trend (4 day EMA) of NYSE new highs divided by new highs + new lows (NY HL Ratio), in blue. Dashed vertical lines have been drawn on the 1st trading day of each month.
Dashed horizontal lines have been drawn, on the Y axis at 10% levels for the indicator; the line is solid at the 50%, neutral level (equal numbers of new highs and new lows).
NY HL Ratio is near the Y axis limit; it cannot go much lower.
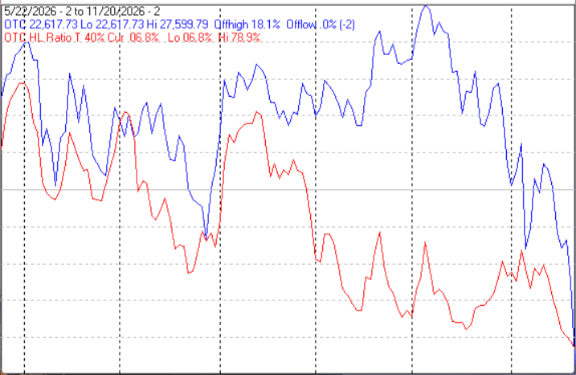
The next chart is similar to the one above except it shows the Nasdaq composite (OTC) in blue and OTC HL Ratio, in red was calculated with Nasdaq data.
OTC HL Ratio also has little room on the downside.
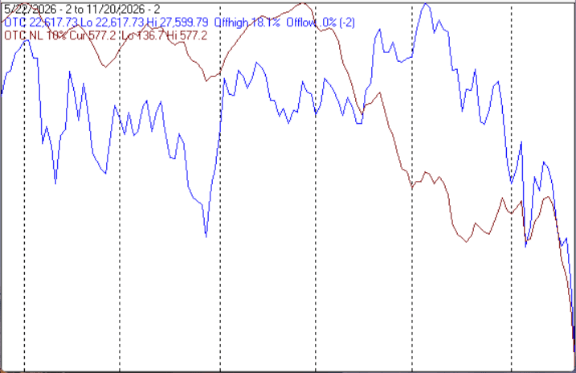
The next chart covers the past 6 months showing the OTC in blue and a 10% trend (19 day EMA) of Nasdaq new lows (OTC NL) in brown. OTC NL has been plotted on an inverted Y axis so decreasing numbers of new lows move the indicator upward (up is good).
OTC NL continued moving downward. Roughly 20% of all issues traded on both the NYSE and Nasdaq hit 52 week lows last Friday.
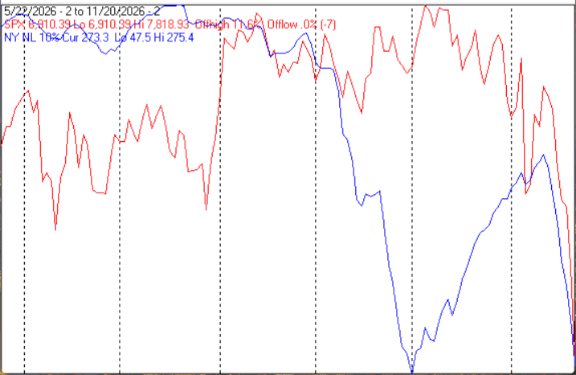
The next chart is similar to the previous one except it shows the SPX in red and NY NL, in blue, has been calculated with NYSE data.
NY NL There were 565 new 52 week lows last Friday; A crash worthy number.
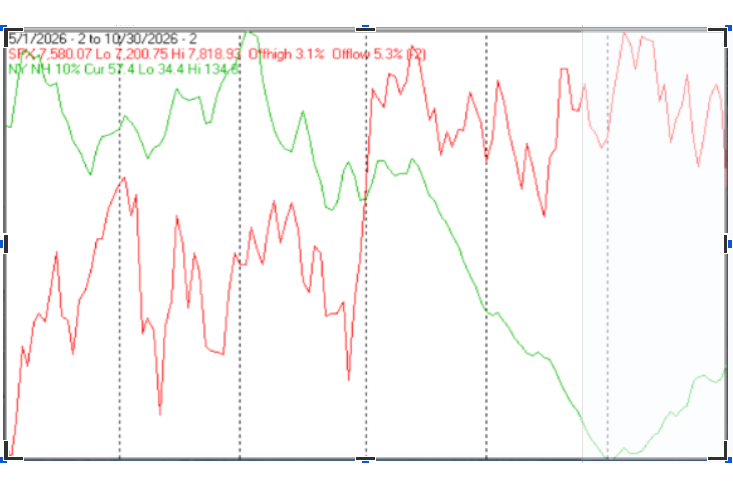
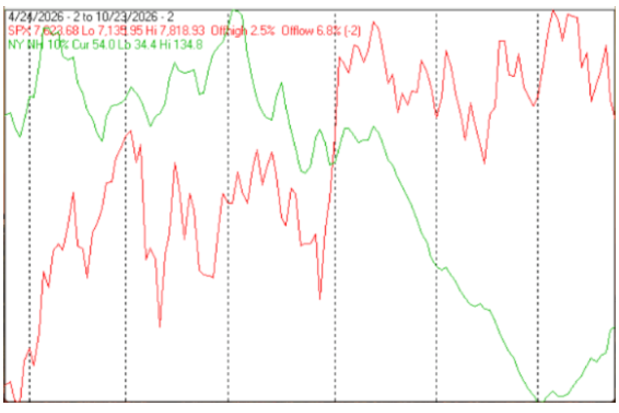
The next chart covers the past 6 months showing the SPX in red and a 10% trend (19 day EMA) of NYSE new highs (NY NH) in green.
NY NH continued declining last week. 0 is the theoretical limit for this indicator. Its current level of 42 is getting pretty close.
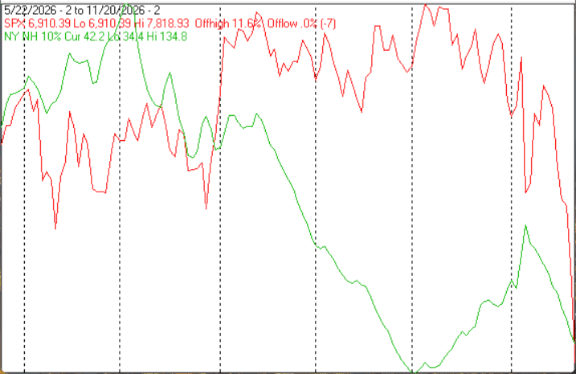
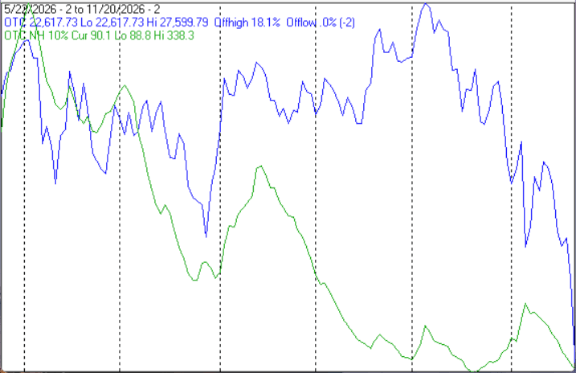
The next chart is similar to the one above except it shows the OTC in blue and OTC NH in green has been calculated with Nasdaq data.
OTC NH has been dancing around its lowest level in over a year and a half.
The Positives
The market is so oversold that a relief rally is likely.
Seasonality
Next week includes the 4 trading days in the week of Thanksgiving during the 2nd year of the Presidential Cycle. The tables below show the daily change, on a percentage basis, for that period.
OTC data covers the period from 1963 to 2025 while SPX data runs from 1953 to 2025. There are summaries for both the 2nd year of the Presidential Cycle and all years combined. Prior to 1953 the market traded 6 days a week, so that data has been ignored.
Seasonality for the coming week has been positive by all measures, but a little weaker during the 2nd year of the Presidential Cycle than other years.
Report for the week before the 4th Friday of November.
The number following the year is the position in the Presidential Cycle.
Daily returns from Monday through the 4th Friday.
OTC Presidential Year 2 (PY2)
Year Mon Tue Wed Thur Fri Totals
1966-2 -0.31% -1.00% -0.42% 0.00% 0.18% -1.54%
Avg -0.31% -1.00% -0.42% 0.00% 0.18% -1.54%
1970-2 0.47% 0.28% 0.31% 0.00% 0.25% 1.32%
1974-2 -3.60% -1.87% -0.30% 1.22% 0.94% -3.60%
1978-2 0.72% 0.04% 0.71% 0.00% 0.69% 2.17%
1982-2 -1.58% -0.27% 0.76% 0.00% 0.78% -0.32%
1986-2 0.41% 0.24% 0.34% 0.00% 0.40% 1.38%
Avg -0.72% -0.32% 0.36% 1.22% 0.61% 0.19%
1990-2 0.54% -1.26% 0.14% 0.00% 0.08% -0.51%
1994-2 -0.91% -2.18% -0.61% 0.00% 0.79% -2.91%
1998-2 2.57% -0.58% 0.88% 0.00% 1.65% 4.52%
2002-2 -1.24% -1.38% 3.26% 3.40% 0.08% 4.13%
2006-2 0.28% 0.09% 0.45% 0.00% -0.23% 0.59%
Avg 0.25% -1.06% 0.83% 3.40% 0.47% 1.17%
2010-2 0.55% -1.46% 1.93% 0.00% -0.34% 0.68%
2014-2 0.89% 0.07% 0.61% 0.00% 0.09% 1.66%
2018-2 -3.03% -1.70% 0.92% 0.00% -0.48% -4.29%
2022-2 -1.09% 1.36% 0.99% 0.00% -0.52% 0.74%
OTC summary for PY2 (1966 - 2022)
Avg -0.35% -0.64% 0.67% 2.31% 0.29% 0.27%
Win% 53% 40% 80% 100% 73% 60%
OTC summary for all years 1963 - 2025
Avg -0.13% -0.11% 0.29% 0.63% 0.37% 0.51%
Win% 49% 53% 71% 70% 76% 65%
SPX PY2
Year Mon Tue Wed Thur Fri Totals
1954-2 0.39% 1.34% 0.56% 0.00% 0.96% 3.25%
1958-2 -2.60% -0.60% 1.72% 0.00% 1.12% -0.36%
1962-2 -0.57% 1.05% 0.60% 0.00% 1.20% 2.28%
1966-2 -1.44% -0.52% 0.68% 0.00% 0.80% -0.49%
1970-2 0.62% 0.64% 0.37% 0.00% 0.99% 2.61%
1974-2 -3.67% -1.54% -0.44% 0.41% 1.06% -4.19%
1978-2 0.88% -0.25% 0.49% 0.00% 0.32% 1.45%
1982-2 -2.04% -0.96% 0.71% 0.00% 0.75% -1.54%
Avg -1.13% -0.53% 0.36% 0.41% 0.78% -0.43%
1986-2 0.65% 0.29% 0.24% 0.00% 0.18% 1.36%
1990-2 0.70% -1.26% 0.23% 0.00% -0.29% -0.63%
1994-2 -0.69% -1.79% -0.03% 0.00% 0.52% -1.99%
1998-2 2.12% -0.44% 0.33% 0.00% 0.45% 2.47%
2002-2 -1.04% -0.40% 1.94% 2.15% -0.34% 2.30%
Avg 0.35% -0.72% 0.54% 2.15% 0.10% 0.70%
2006-2 -0.05% 0.16% 0.23% 0.00% -0.37% -0.02%
2010-2 -0.16% -1.43% 1.49% 0.00% -0.75% -0.84%
2014-2 0.29% -0.12% 0.28% 0.00% -0.25% 0.20%
2018-2 -1.66% -1.82% 0.30% 0.00% -0.66% -3.83%
2022-2 -0.39% 1.36% 0.59% 0.00% -0.03% 1.53%
Avg -0.39% -0.37% 0.58% 0.00% -0.41% -0.59%
SPX summary for PY2 1954 - 2022
Avg -0.48% -0.35% 0.57% 1.28% 0.31% 0.20%
Win% 39% 33% 89% 100% 61% 50%
SPX summary for all years 1953 - 2025
Avg -0.13% 0.06% 0.25% 0.47% 0.25% 0.50%
Win% 45% 58% 76% 64% 74% 66%
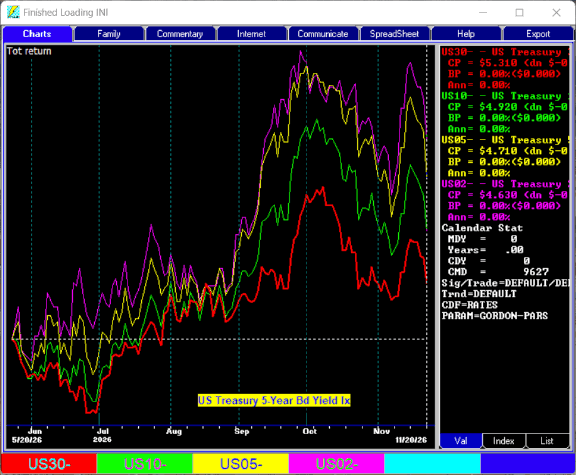
Treasury rates at their close last Friday and their changes from last month:
2yr yield 4.651% down from 4.797%
5yr yield 4.739% down from 5.026%
10yr yield 4.944% down from 5.237%
30yr yield 5.375% down from 5.602%
The next chart, made with FastTrack, covers the past 6 months showing a relative comparison of US treasury interest rates. 30 year in red, 10 year in green, 5 year in yellow and 2 year in purple.
Conclusion
Last week all of the major indices were down 8% - 10%. There cannot be many repeats of that. That kind of move is so rare there are too few examples to compare it to.
The conspiracy theorist in me has me thinking Nvidia (NVDA)’s president Jensen Huang may have left all of his positions in the company so that he could make huge sales of Nvidia stock without having to report it as an officer of the company. He had to know what was coming.
The strongest sectors last week were Utilities (for the 8th week in a row) and Leisure while the weakest were Precious Metals (for the 2nd week in a row) and Electronics.
I expect the major averages to be lower on Friday November 27 than they were on Friday November 20.
Comments
Log in or sign up to join the conversation.