

Technical market report for March 14, 2020
The good news is:
Identifying a bottom should be easy.
The Negatives
The end of this decline, when it comes, will be signaled by a rapid decline in the number of new lows. We have not seen that.
The first chart covers the past 6 months showing the NASDAQ composite (OTC) in blue and a 10% trend (19 day EMA) of NASDAQ new lows (OTC NL) in black. OTC NL has been plotted on an inverted Y axis so decreasing new lows move the indicator upward. Dashed vertical lines have been drawn on the 1st trading day of each month.
We have a record. 649 is the highest value ever achieved by this indicator.

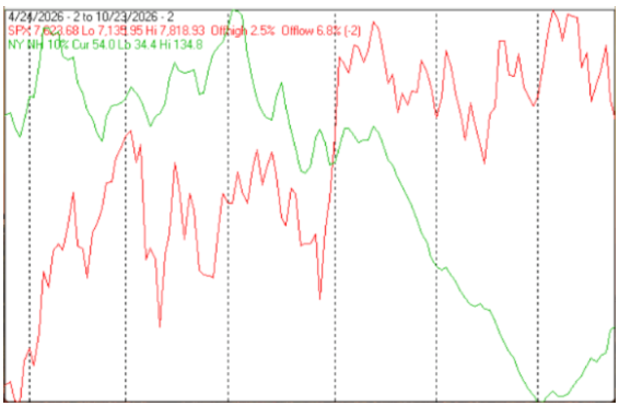
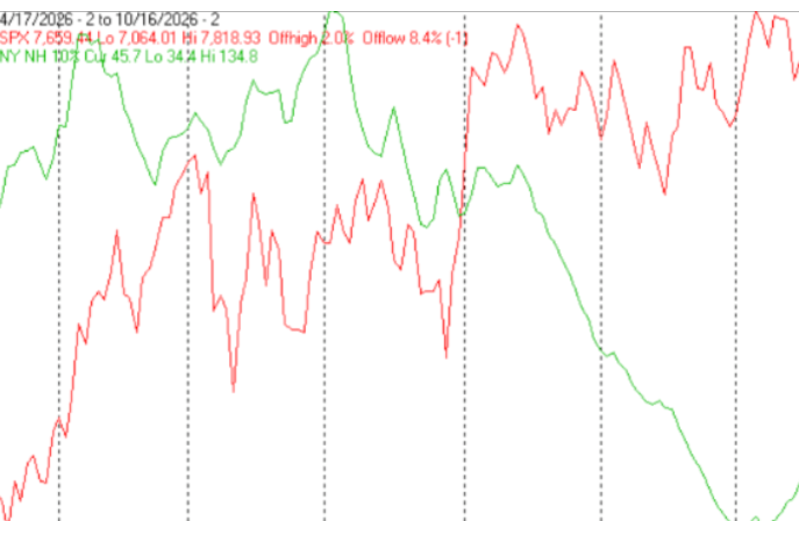
The next chart is similar to the first one except it shows the S&P 500 (SPX) in red and NY NL has been calculated from NYSE data.
No record here. 701 was the value Friday up from 707 Thursday. There is quite a way to go for a record. The record for NY NL was set October 10, 2008 at 1129.

The next chart covers the past 6 months showing the OTC in blue and a 40% trend (4 day EMA) of NASDAQ new highs divided by new highs + new lows (OTC HL Ratio), in red. Dashed horizontal lines have been drawn at 10% levels for the indicator; the line is solid at the 50%, neutral, level.
Last week I wrote “OTC HL Ratio at 17% cannot get much worse.”
At 2.2% on Friday, it did get much worse.

The next chart is similar to the first one in this group except it shows the SPX in red and NY HL Ratio, in blue, has been calculated with NYSE data.
Last week; NY HL at 9% does not have room to get much worse.
This week on Friday it was 1.2%.

The Positives
The buy the dips crowd and Plunge Protection Team (PPT) AKA The working group on Financial Markets were out in force again last week.
Volume of ADVANCING issues on the OTC was the strongest ever last week.
The chart below covers the past 6 months showing the OTC in blue and a 5% trend (39 day EMA) of volume of advancing issues (OTC UV 5%) in green.
OTC UV 5% set another record Friday.

The next chart is similar to the one above except it shows the SPX in red and NY UV 5% has been calculated with NYSE data.
No records here, but buyers are out there trying to catch the falling knives.

Seasonality
Next week includes the 5 trading days prior to the 3rd Friday of March during the 4th year of the Presidential Cycle. The tables below show the daily change, on a percentage basis, for that period.
OTC data covers the period from 1963 to 2018 while SPX data runs from 1953 to 2018. There are summaries for both the 4th year of the Presidential Cycle and all years combined. Prior to 1953 the market traded 6 days a week so that data has been ignored.
Average returns for the coming week have been mixed.
Given the current panic, seasonal averages are not relevant.
Report for the week before the 3rd Friday of March.
The number following the year is the position in the Presidential Cycle.
Daily returns from Monday through 3rd Friday.
OTC Presidential Year 4 (PY4)
Year Mon Tue Wed Thur Fri Totals
1964-4 0.05% -0.03% 0.08% -0.40% -0.24% -0.53%
1968-4 -0.06% 0.92% 0.47% 0.18% -2.16% -0.65%
1972-4 -0.94% 0.31% 0.32% -0.29% 0.19% -0.41%
1976-4 -1.40% 0.16% 0.28% -0.62% -0.01% -1.59%
1980-4 -3.28% -0.56% 0.76% -0.24% -0.60% -3.92%
1984-4 0.29% 0.37% -0.17% 0.32% 0.92% 1.74%
1988-4 0.32% -0.03% 0.52% 0.57% 0.23% 1.62%
1992-4 -0.11% 0.86% 0.27% 0.16% -0.27% 0.92%
1996-4 1.58% -0.68% 1.44% 0.23% 0.78% 3.35%
Avg -0.24% -0.01% 0.56% 0.21% 0.21% 0.74%
2000-4 -2.80% -4.09% -2.63% 2.94% 1.71% -4.87%
2004-4 -2.29% 0.20% 1.73% -0.72% -1.12% -2.20%
2008-4 3.04% 0.61% -0.71% -1.87% -0.86% 0.21%
2012-4 -0.16% 1.88% 0.03% 0.51% -0.04% 2.23%
2016-4 0.04% -0.45% 0.75% 0.23% 0.43% 0.99%
Avg -0.43% -0.37% -0.17% 0.22% 0.03% -0.73%
OTC summary for PY4 1964 - 2016
Avg -0.41% -0.04% 0.22% 0.07% -0.07% -0.22%
Win% 43% 57% 79% 57% 43% 50%
OTC summary for all years 1963 - 2019
Avg -0.08% 0.06% 0.04% 0.16% -0.08% 0.11%
Win% 54% 54% 65% 72% 53% 60%
SPX PY4
Year Mon Tue Wed Thur Fri Totals
1956-4 0.92% -0.15% 1.00% 0.97% 0.31% 3.05%
1960-4 0.15% 0.77% 0.55% -0.15% 0.09% 1.41%
1964-4 0.00% 0.23% 0.08% -0.10% -0.48% -0.28%
1968-4 1.24% 0.11% -0.22% -1.90% 0.88% 0.11%
1972-4 -0.96% 0.26% 0.13% -0.23% 0.39% -0.41%
1976-4 -1.05% 1.12% -0.06% -0.41% 0.13% -0.27%
Avg -0.16% 0.50% 0.09% -0.56% 0.20% 0.11%
1980-4 -3.01% 1.80% 0.20% -1.14% -0.79% -2.93%
1984-4 1.29% 0.28% -0.01% 0.41% 1.18% 3.15%
1988-4 0.54% -0.09% 0.95% 0.96% -0.04% 2.32%
1992-4 0.14% 0.78% -0.10% 0.16% 0.37% 1.34%
1996-4 1.03% -0.46% 0.23% 0.36% 0.09% 1.25%
Avg 0.00% 0.46% 0.25% 0.15% 0.16% 1.03%
2000-4 -0.82% -1.76% 2.42% 4.77% 0.41% 5.01%
2004-4 -1.43% 0.56% 1.17% -0.13% -1.12% -0.94%
2008-4 1.29% 0.23% -0.88% -1.15% -0.80% -1.30%
2012-4 0.02% 1.81% -0.12% 0.60% 0.11% 2.42%
2016-4 -0.13% -0.18% 0.56% 0.66% 0.44% 1.35%
Avg -0.22% 0.13% 0.63% 0.95% -0.19% 1.31%
SPX summary for PY4 1956 - 2016
Avg -0.05% 0.33% 0.37% 0.23% 0.07% 0.96%
Win% 60% 69% 63% 50% 69% 63%
SPX summary for all years 1953 - 2019
Avg 0.06% 0.18% 0.15% 0.20% 0.02% 0.61%
Win% 64% 55% 60% 57% 58% 64%
Money supply (M2) and Interest Rates
The following charts were supplied by Gordon Harms.
M2 growth leveled off at an accelerated pace.

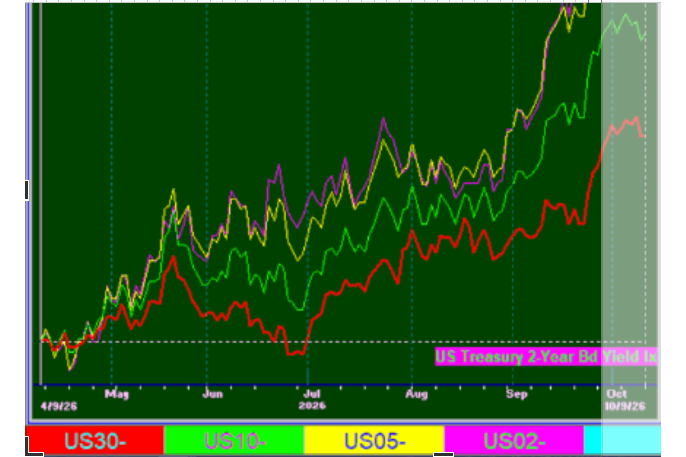
Interest rates at their close last Friday and their changes from last month:
2yr yield 0.506% down from 1.424%
5yr yield 0.718% down from 1.419%
10yr yield 0.981% down from 1.588%
30yr yield 1.548% down from 2.041%

The next chart is a close up showing just the past year from the chart above.

Conclusion
There has been no sign of a bottom.
The strongest sectors last week were Energy (XLE) (not as far to fall) and Telecom; the weakest were Energy Services and Basic Materials (XLB).
I expect the major averages to be lower on Friday March 20 than they were on Friday March 13.
Comments
Log in or sign up to join the conversation.