
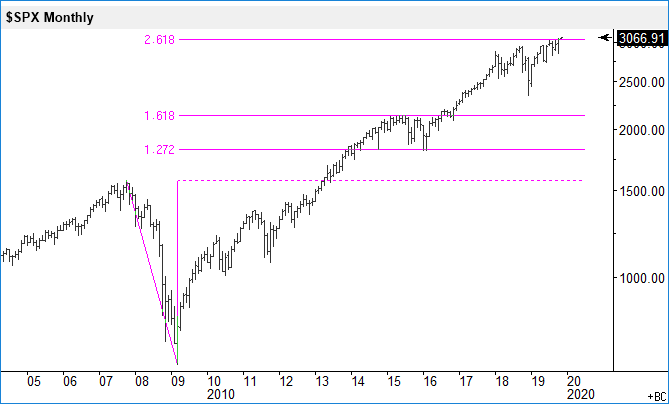
Here is an updated monthly chart of the S&P 500 index on a semi-log scale. The 2.618% fib extension at 3.047 has been hit intra-month. Need to see if the index can close above that level on a monthly basis; if it does, then that would be very bullish.
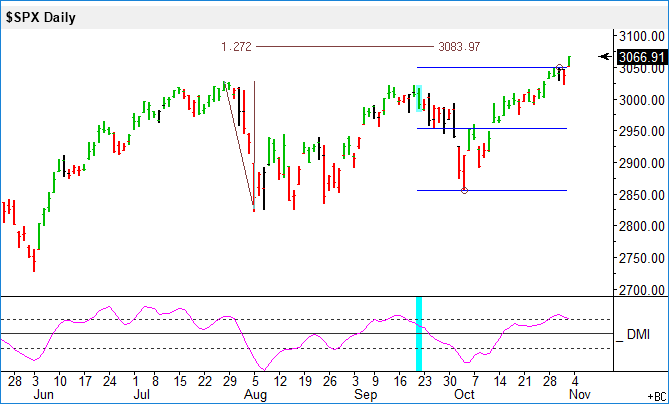
The daily chart looks strong with the index hitting new 30-day highs, confirmed with strong momentum. The next possible target comes in at 3.084.

Comments
Log in or sign up to join the conversation.