


The S&P 500 fell about 1.5% this week, while the Nasdaq dropped around 4%. The SMH, which we have been watching closely, fell about 9%, and XLK dropped 5.5%. Technology and semiconductors have weighed on the overall market, and for the most part, that isn’t surprising. Liquidity flows have changed materially, and the expectation is that these flows will continue to worsen over the next couple of weeks before beginning to improve around the beginning of September.
The flows I’m referring to are Treasury bill settlements. This past week alone, bills saw about $65 billion in net new settlements. Next week brings another $56 billion on Tuesday (7/21) and $37 billion on Thursday (7/23). These numbers should continue to rise for another week or so into the last week of July, then begin to diminish as we go through August, and eventually flip back into some form of paydowns from early to mid-September, which would add some liquidity back to the market.
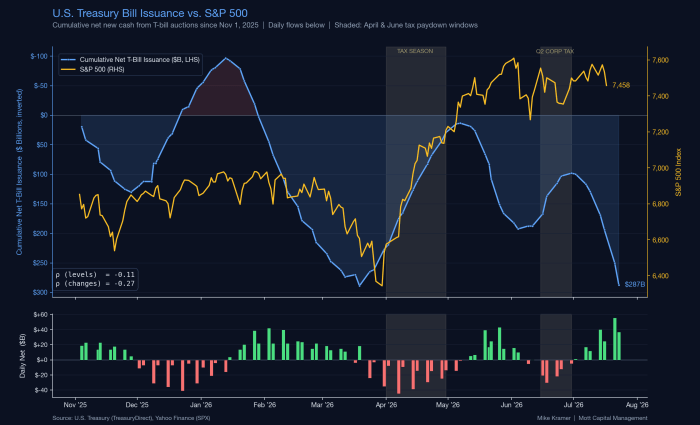
The draining of liquidity through these settlements seems to have had a pretty powerful impact on markets overall. Using the T-bill settlement calendar I built and maintain, which runs from the beginning of November, there have been 42 T-bill settlement dates. XLK has risen on only 19 of the 42, a 45% win rate, with an average decline of 41 basis points on a settlement date. That compares with 134 non-settlement dates, during which XLK has risen 66% of the time, with an average gain of 26 basis points.
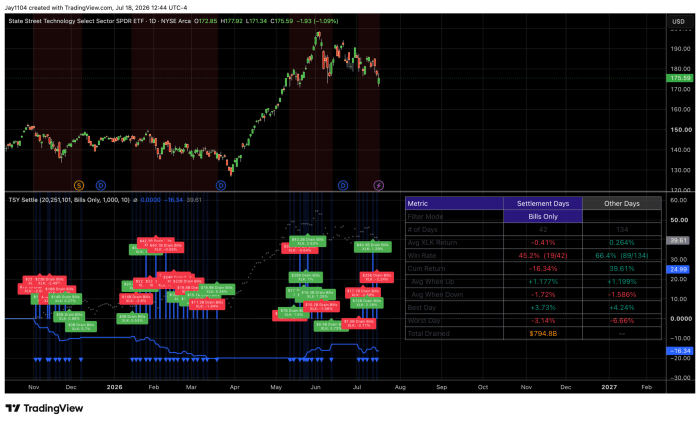
The same thing shows up in the S&P 500. On settlement dates, the index has risen 45% of the time, with an average decline of 22 basis points, whereas on non-settlement dates it has risen 60% of the time, with an average gain of about 14 basis points. The market isn’t going to fall every day just because it’s a settlement date; that’s simply what the statistics say. They also tell us that when the market does rise on a settlement date, it gains about 50 basis points, and when it falls, it drops about 83 basis points. On non-settlement dates, the up days average 65 basis points, and the down days average 60 basis points. So even when a settlement date goes well, we would expect the market to rise less than normal, and when it goes down, to fall more.
The reason we have been following this goes back to the New York Fed’s reverse repo facility. When that facility rose dramatically, it was, in essence, excess liquidity being drained from the marketplace, pushing reserves held at the Fed lower. You can learn more about T-bill settlement and the draining effects here.
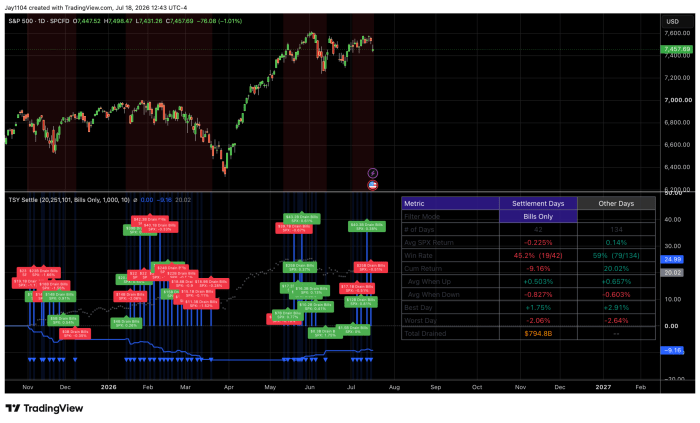
The cumulative T-bill issuance picture going back to November has been fairly consistent. During the period when settlements were rapidly increasing, the S&P 500 eventually declined, and as settlements improved, the S&P 500 rose. We then went through a topping period, where net settlements and paydowns kept intermixing, and now we’re entering a period where settlements ramp up materially. The software sector has traced a similar path, rallying as the paydowns continued and now back in a settlement state.
If this continues to play out the way it has statistically for almost nine months, the period between now and the beginning of September, maybe even the first couple of weeks of September, will probably be a fairly difficult stretch for markets. We should get a bit of a reprieve in the middle of September, and then probably head back into a heavy T-bill issuance period into year-end, similar to what we saw at the end of last year.


Comments
Log in or sign up to join the conversation.