

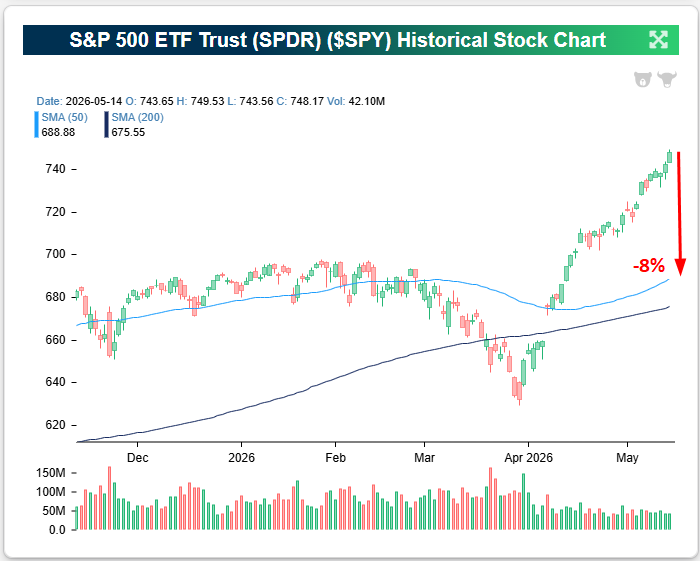
The S&P 500 (SPY) has been driven higher by large-cap hyperscalers and semiconductors over the last month. This has pushed the index significantly above its 50-day moving average, indicating it's well above trend right now.
As shown below, the index would need to fall 8% just to get back down to its 50-DMA from these levels!
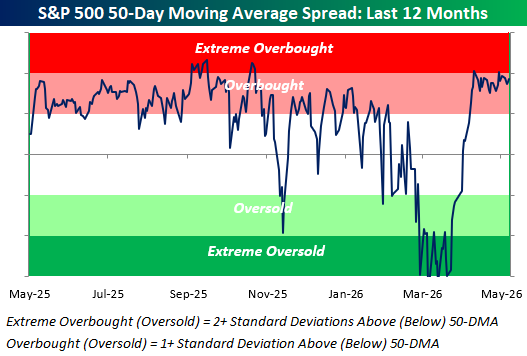
The S&P's price has now been "overbought" (more than one standard deviation above its 50-DMA) for 23 straight trading days:
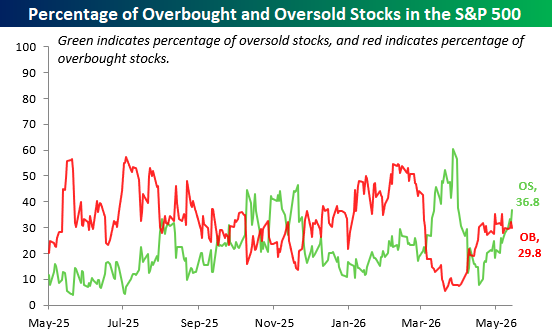
But while price is overbought, the underlying breadth in the index looks absolutely horrific.
With the S&P remaining at overbought levels for more than a month, one would expect a majority of stocks in the index to be overbought as well. In reality, though, more than a third (36.8%) of S&P 500 stocks are actually "oversold" (more than one standard deviation below the 50-DMA), while just 29.8% are overbought.
The fact that so many more stocks are oversold than overbought in the S&P, even with the index's price elevated well above its 50-DMA, highlights the narrowness of the recent rally.
Passive index investors have benefited even with the narrowness, but active investors without exposure to the AI infrastructure stocks have had a rough go of it.


Comments
Log in or sign up to join the conversation.