
.jpg")
🏛️ Market Brief – A Tech-Only Selloff
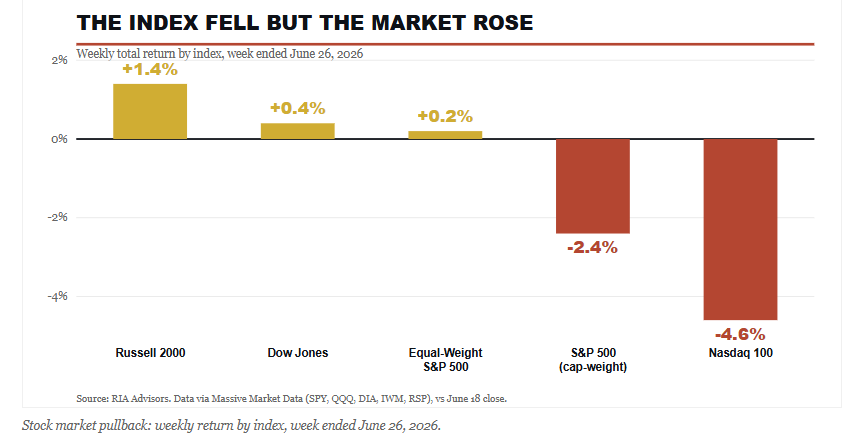
The headline looks ugly until you turn it over. The S&P 500 finished the week at 7,306, down 2.4% from the prior Friday, while the Nasdaq 100 dropped a hard 4.6% as the megacap technology names that have carried this market all year finally took a real hit. Most stocks rose anyway.
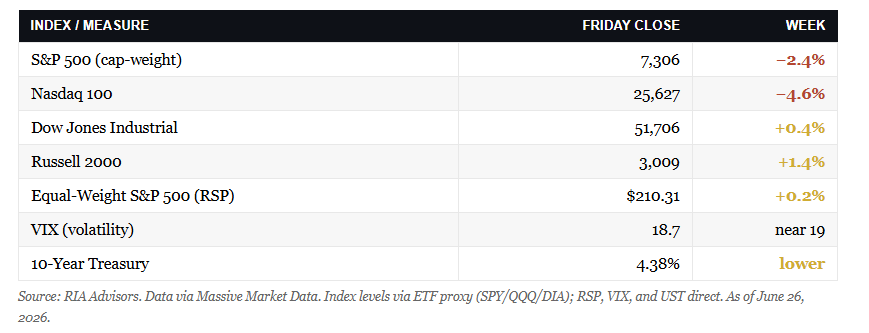
However, the Dow gained 0.4%, the Russell 2000 added 1.4%, and the equal-weight S&P 500 still closed green on the week. The index fell, but the market underneath it did not.
The macro backdrop set the tone. Micron (MU) kicked off the week with a blowout, the stock jumping almost 16% on a strong quarter and a memory-pricing story that lifted the entire semiconductor group. That should have been rocket fuel. Instead, the rest of the AI complex sold the news, and the heaviest names in the index dragged it lower all week. Yields helped at the margin. The ten-year eased back toward 4.38% as money rotated out of crowded growth and into bonds and defensives, which is the kind of internal repair we like to see.
We have been making this case for weeks. As we warned recently in the Bull Bear Report on narrow leadership, a market carried by a handful of names is one bad week away from looking sick, even as it gets healthier. That is exactly what happened. Breadth improved, the average stock rose, and the cap-weight headline took the hit because that is where all the concentration lives.
Here is the simple read. A stock market pullback that shows up only in the most expensive, most crowded corner of the market, while everything else holds or rises, is a rotation. It is not the start of a top. We will watch the follow-through, but the internals this week leaned bullish rather than bearish.
📈Technical Backdrop – Sitting Just Below The 50-DMA
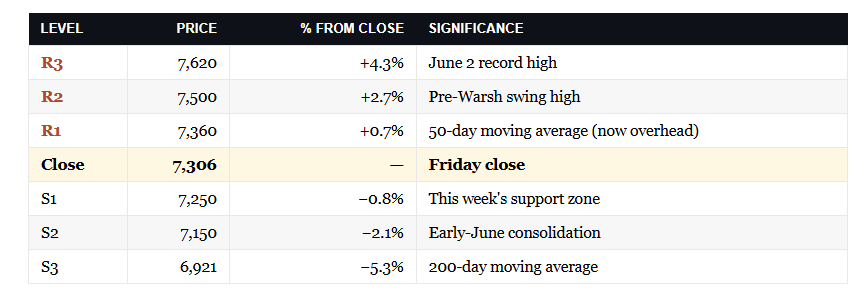
Let’s anchor the picture in the actual tape. The S&P 500 closed the week at 7,306, which put it about 0.7% below its 50-day moving average near 7,360. That’s the first close beneath the 50-day since the rally off the April low, and it matters as a signal even though the distance is small. The index still sits roughly 5.6% above its rising 200-day average near 6,921, so the larger uptrend is intact. This stock market pullback has pushed the index down about 4.1% from the June 2 record high of 7,620.
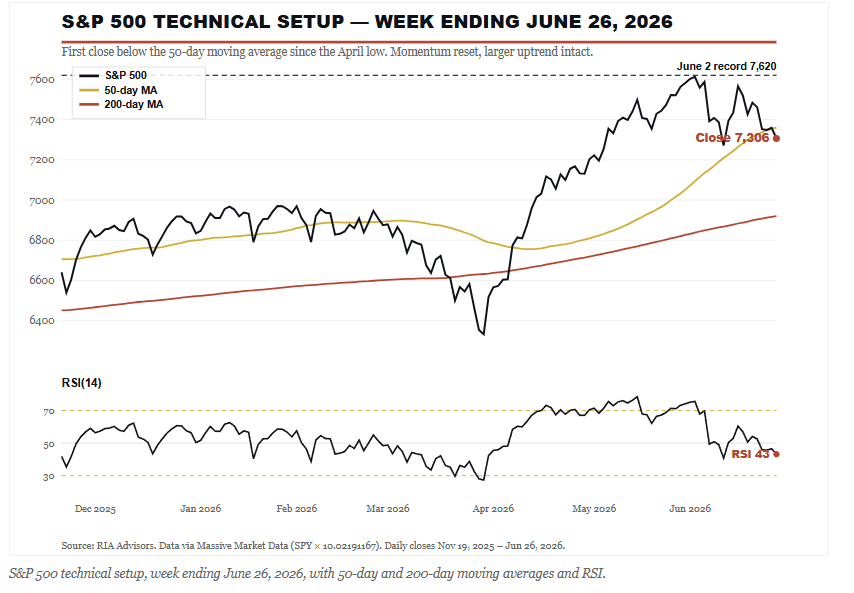
Momentum has cooled, not collapsed. The 14-day RSI sits in the low 40s, down from readings above 75 at the start of June, which is exactly the kind of reset a stretched, overbought market needs before it can push higher again. The MACD has rolled over below its signal line with the histogram widening to the downside, so the short-term trend points lower. That’s a caution flag for traders, not a reason for long-term investors to abandon ship.
Here’s where it gets interesting. Breadth improved while the index fell. The equal-weight S&P beat the cap-weight by more than two and a half points on the week, one of the widest gaps in favor of the average stock we’ve seen in months. Going into this pullback, only about 58% of S&P members traded above their own 50-day average, well short of the 70% to 80% you want to see in a healthy advance. A rotation that lifts the laggards is precisely how that number repairs itself.
In the ETF Sector Rotation Model, we didn’t chase the most extended winners. We trimmed our most stretched technology exposure back toward target weight earlier this month, added to defensive positions, and let the cash buffer ride. That posture did its job this week while the crowded names took the hit.
The level that matters most in the new month is that 50-day average near 7,360. A weekly close back above it keeps the uptrend humming and sets up a retest of 7,500 and then the 7,620 record. A decisive break below 7,250, this week’s support zone, opens the door toward 7,150 and, if the selling accelerates, the 200-day moving average near 6,921. Manage risk at the line, not after it breaks.
Trade accordingly.
🔑 Key Catalysts Next Week
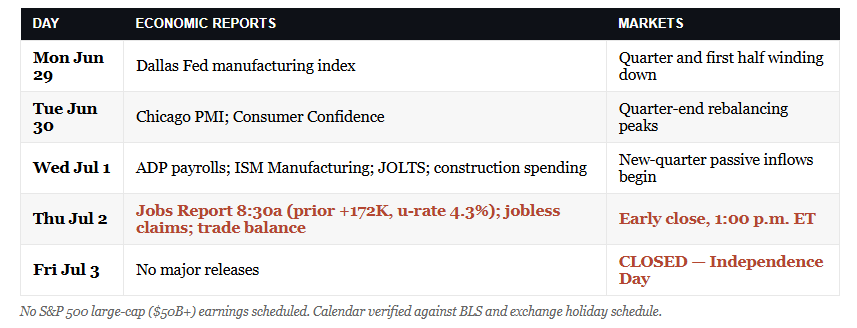
Next week is short and front-loaded with the one number that can move everything. The market closes Friday, July 3, for the Independence Day holiday, and it closes early at 1 p.m. on Thursday. So the entire week funnels into a jobs report that lands on a holiday-shortened session with the thinnest liquidity of the quarter.
The June employment report hits Thursday, July 2, at 8:30 a.m., pulled forward a day because of the holiday. May payrolls came in at 172,000 with the unemployment rate steady at 4.3%, well above the cooling that economists had penciled in, so the labor market is still running warmer than the Warsh Fed would like heading into its new hawkish lean. A hot number complicates that lean and could send the ten-year right back toward 4.5%.
The runway into Thursday is busy. ADP private payrolls, the ISM manufacturing index, and the JOLTS job openings report all land on Wednesday, July 1, and together they will frame expectations for the main event. On the Street, the debate is real. Some strategists look for payrolls to soften toward 130,000 as hiring finally cools, while others see another upside surprise that keeps the Fed boxed in. Friday’s number settles it.
A thin holiday tape can exaggerate any reaction, in either direction. With dealers light and desks half-staffed, a payroll surprise on Thursday morning could move the market more than the same print would on a normal Friday. Here is the week at a glance.
Beyond the data, watch the bond market. If yields keep easing, the defensive bid that led this week is likely to continue, and the rotation has more room to run. If a hot jobs print pushes the ten-year back toward 4.5%, expect the pressure to land right back on the long-duration growth names that just took the worst of it.
💰 The Stock Market Pullback This Week Was Healthier Than It Looked
This stock market pullback has investors reaching for the panic button, and I understand why. A 2.4% drop in the headline index and a 4.6% slide in the Nasdaq 100 make for ugly weekend headlines. But the story underneath those numbers is the opposite of what the headlines suggest. As I argued in our recent work on narrow market leadership, the risk in this market was never that the average stock was overvalued. The risk was that a handful of giant names had come to dominate the entire market. This week, that finally started to correct.
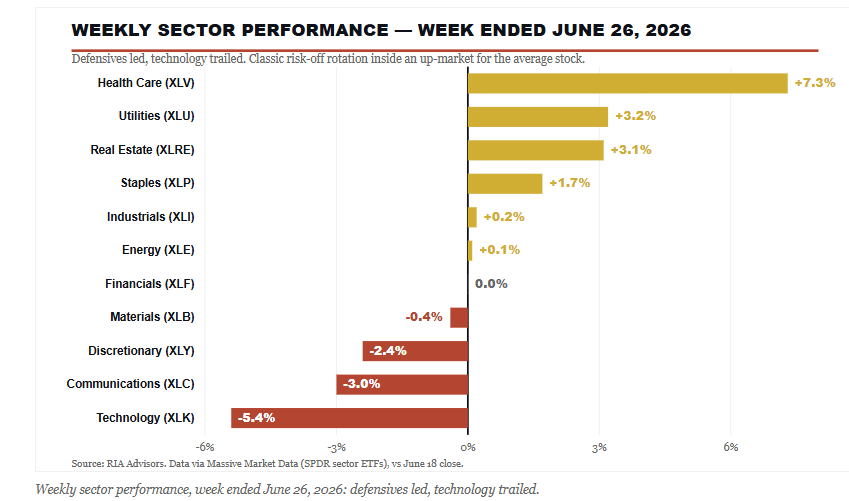
Look at where the damage from this stock market pullback actually landed. Technology fell 5.4% on the week, and communication services dropped 3%, the two sectors stuffed with the megacap AI trade. Everything defensive went the other way. Health care surged 7.3%, utilities and real estate each rose more than 3%, and consumer staples added 1.7%. That is a textbook risk-off rotation, money leaving the crowded, expensive trade and moving into the cheaper, steadier one.
Howard Marks has written for years that the riskiest moment arrives when everyone believes there is no risk. For most of this year, the crowd believed exactly that about the AI complex. A stock market pullback that punishes only that corner while lifting nearly everything else is the market quietly repricing risk where it has actually built up. That is healthy. It is how bull markets refresh themselves rather than end.
Why The Bid Went Quiet
Here’s the part the headlines miss entirely. A large share of this week’s selling had nothing to do with fundamentals and everything to do with the calendar. As we detailed in our recent piece on market flows, two mechanical forces simultaneously drained the bid.
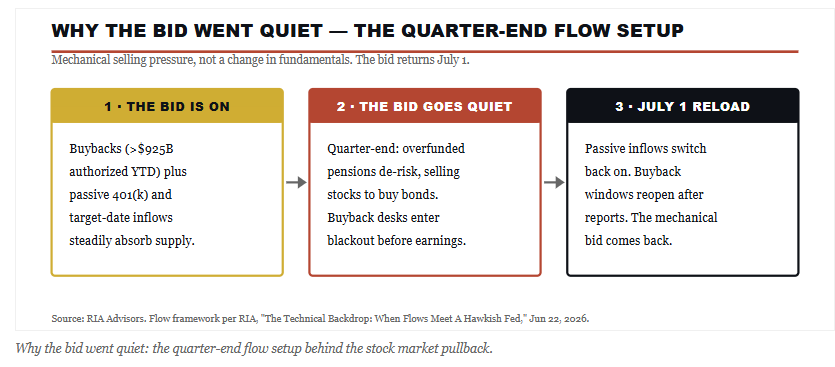
First, quarter-end. The biggest corporate pension funds sit near 110% funded, and at the end of a strong quarter, the rules push them to sell stocks and buy bonds to lock in gains and de-risk. Second, the buyback blackout. Corporations have authorized more than $925 billion in repurchases this year, and that buying machine goes quiet in the weeks before earnings as companies enter their blackout window. Take away the single largest buyer of stocks, add forced quarter-end selling, and you get a stock market pullback that looks scary on the tape and says very little about the economy.
“The selling this week was MECHANICAL, not fundamental. Both forces reverse the moment the calendar flips. Passive 401(k) and target-date inflows reload on July 1, running well ahead of last year’s record pace, and the buyback window reopens once companies clear their reports. The bid that vanished this week comes back.” – RIA Advisors — The Setup Into July
The Rotation Beneath The Rotation
There is a subtler signal worth watching, and it showed up in Friday’s Daily Market Commentary on Micron. We did something in our Rotation Factor model that looks backward at first glance. We switched from value to growth.
In the model, megacap growth is represented by the MGK basket, so that switch is a specific call. It says buy the washed-out megacaps and step away from the trade that has been leading.
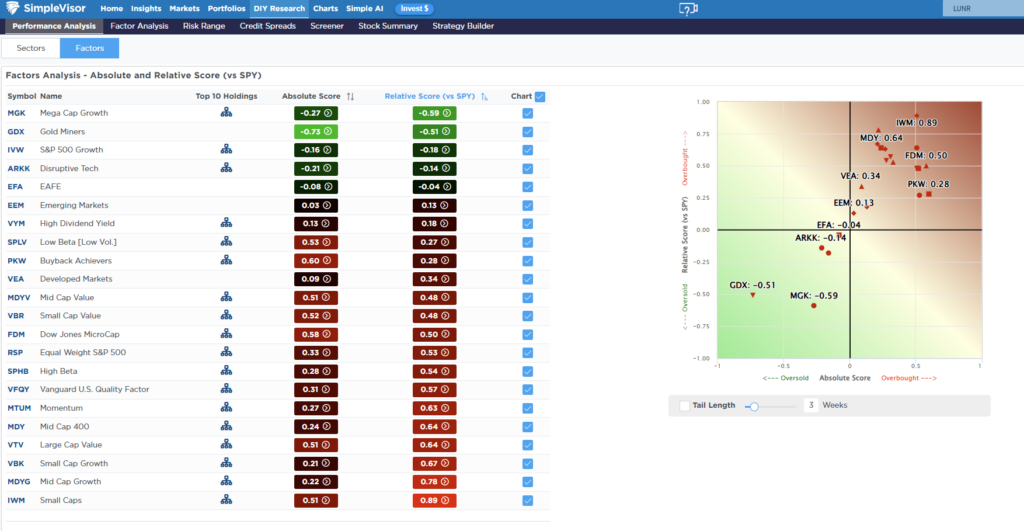
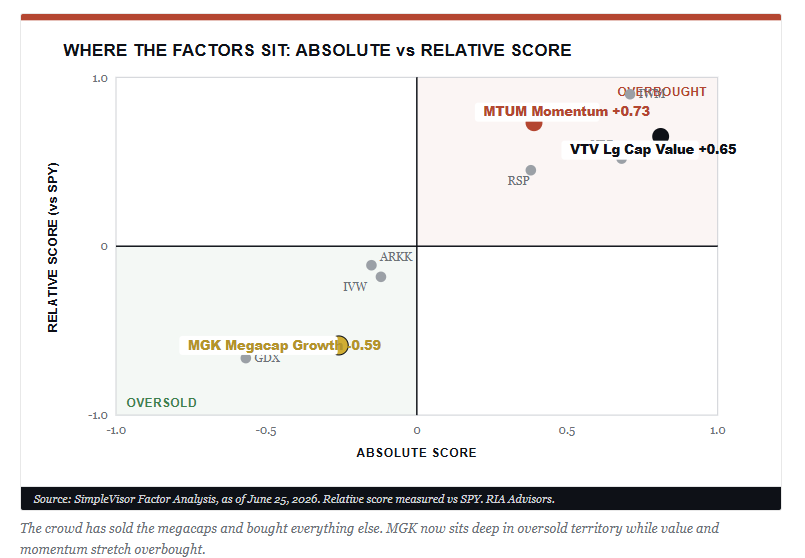
“However, look at where the factors sit on our SimpleVisor screen. Mega-cap growth (MGK) has fallen to a relative score of -0.59 against the index, the most oversold pocket of the large-cap complex. Large-cap value reads +0.65 and momentum +0.73, both stretched. This isn’t subtle. The crowd has spent six months selling the megacaps and chasing everything else.” – Simplevisor.com

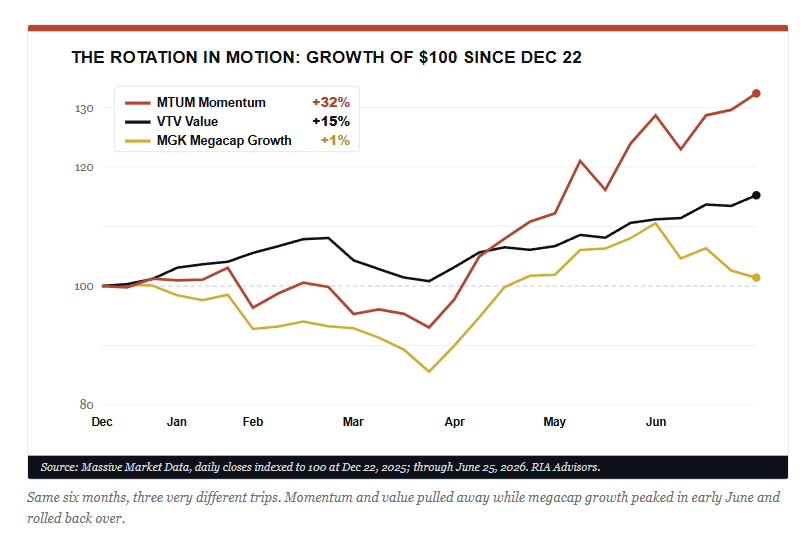
The performance gap confirms it. Since late December, momentum has run up more than 30%, value has gone up around 15%, and mega-cap growth has basically gone nowhere, at just over 1%. A big slice of that “value” win is really a semiconductor trade in disguise. Micron screens as VALUE in most large-cap value indices because of its low multiple on peak memory earnings, and it has gone parabolic. As Bob Farrell’s Rule #4 reminds us, exponential moves usually run further than you think, but they don’t correct by going sideways.
Let me walk you through why, because it mirrors the real rotation we saw on Friday.
Start with where the factors sit on our SimpleVisor screen. MGK, our growth proxy, has fallen to a relative score of minus 0.59. That is the most oversold corner of the entire large-cap market, and it is oversold against both value (plus 0.65) and momentum (plus 0.73), which are each stretched. This isn’t subtle. The crowd has spent six months selling the biggest names and crowding into everything else.
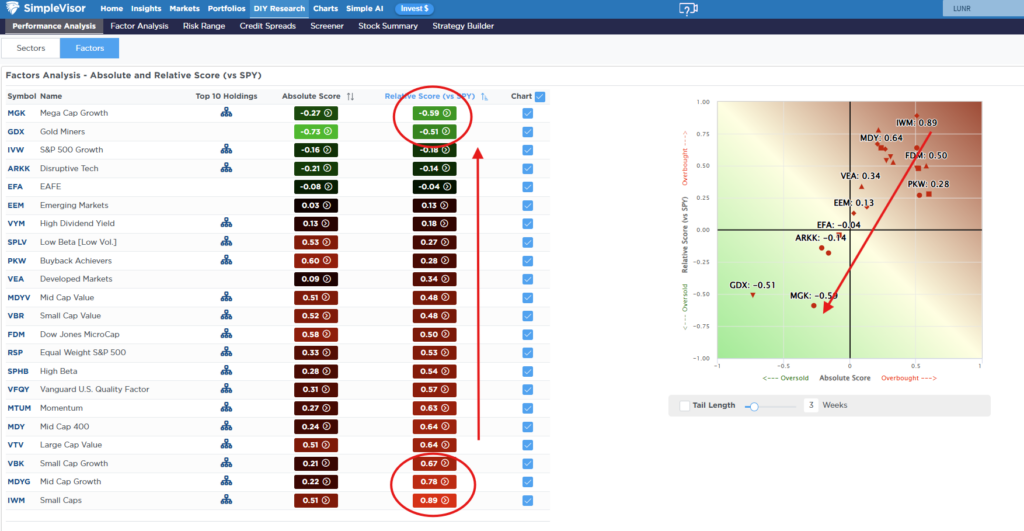
The performance gap confirms it. Since late December, momentum has run more than 30%, value is up around 15%, and megacap growth has gone almost nowhere at just above 1%. Here is the part that matters, and it is the key to reading the switch.
As noted, a big slice of that value win is, in fact, a semiconductor trade in disguise, as Micron and its peers screen as value in most large-cap value indexes because of their low multiples on peak earnings, and those names have gone parabolic.
In other words, the value leadership isn’t broad value at all. It is a crowded semi-trade sitting inside the value box.
That is the rotation beneath the rotation. On Friday, money rotated out of semis and toward the oversold megacaps. The largest, most profitable companies are washed out and unloved heading into the one event that resets the narrative: earnings. Second-quarter reporting starts in earnest in mid-July, and the MGK names report into low expectations and oversold positioning. Those are exactly the conditions that produce mean-reversion rallies.
I’m not calling a top on Micron or the memory cycle. The point is narrower than that. The risk and reward have flipped. Oversold megacap quality, now an earnings catalyst, looks like a better bet versus overbought semiconductors. Make no mistake, oversold can always get more oversold.
Megacap growth is weak for a reason: the market is digesting the AI capital-spending bill. That is the honest counter. However, at some point, the “discounting process” will be complete. The oversold condition, plus a catalyst, plus washed-out positioning, is a very different setup than oversold sitting by itself. Watch the early-July megacap prints for the first signs of a turn.
What Should Investors Do Now
So what do you actually do with a stock market pullback like this one? The honest answer is not much, and that is the point. We trimmed our most stretched technology exposure earlier this month and added to defensives, so the models were positioned for exactly this move. We are not selling into the weakness, and we are not chasing the defensive names that have already run hard.
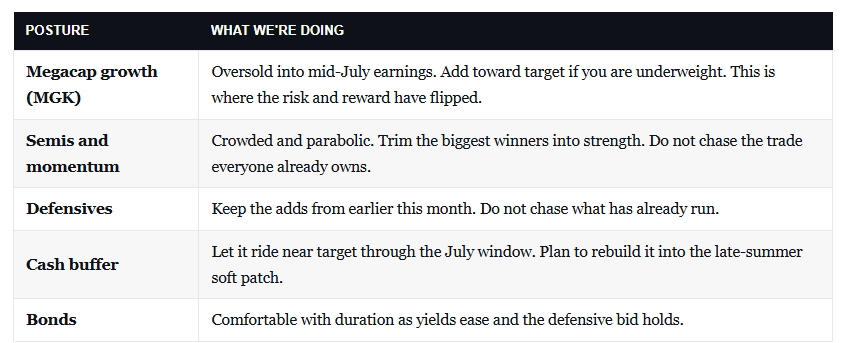
Here is how we are playing the book. The next two weeks set up well. The mechanical bid we discussed earlier reloads on July 1 as fresh-quarter inflows switch back on, and July itself is one of the steadier months on the seasonal calendar, with the firmest action usually in the first half. Put those two together, and you get a real tactical tailwind. We’re using that window to lean back toward the washed-out megacap leaders into mid-July earnings, the setup the Micron note laid out, rather than chasing the crowded semiconductor and momentum trade that has already done its work.
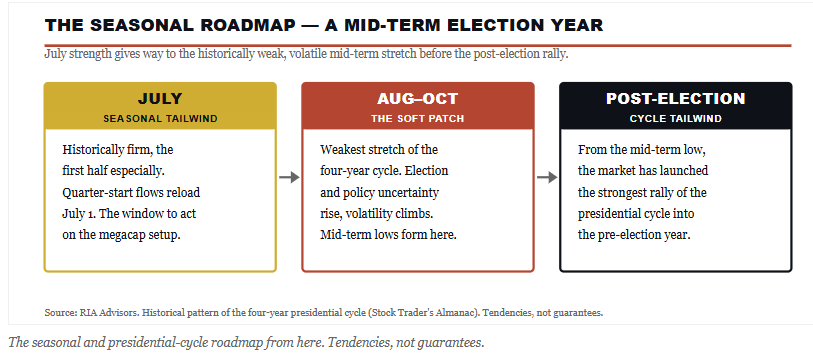
Here is the part most investors will forget after a strong July. The calendar turns against us as summer ends. August through October is the weakest and most volatile stretch of the year in a normal year, and 2026 isn’t a normal year. It is a mid-term election year, and the four-year presidential cycle carries a long history that the Stock Trader’s Almanac has tracked for decades.
The mid-term year is the weakest of the four, and the market has repeatedly carved out a major low in the third or fourth quarter of that year before launching the strongest rally of the entire cycle into the pre-election year that follows.
The why isn’t complicated. Markets hate uncertainty, and a mid-term election manufactures it. Control of Congress is on the table, the post-election path for taxes, spending, and regulation is unknown, and policy tends to stall while the campaign runs. That uncertainty lands right on top of the weakest seasonal window of the year, which is why volatility has so often climbed into the October of mid-term years. None of this is a forecast of doom. It is a reminder that the easy part of the calendar is the next few weeks, and the harder part comes after it.
So take the July window, but don’t get complacent when it works. We plan to rebuild the cash buffer and tighten our discipline as we move into the late-summer soft patch. If the cycle plays to form, the weakness in the fall isn’t the moment to panic. It is the setup to add for the post-election run that has historically been the best stretch of the four-year cycle. Take the seasonal gift in front of us and respect the risk it carries. Keep some powder dry for the opportunity that usually follows.
Stay invested, but stay disciplined. If you are overweight, the megacap AI complex, this is a gift, a chance to trim back toward target on any bounce into earnings. If you have been underweight in the broader market, the rotation is handing you cheaper entry points in the parts that actually need to catch up. Rebalancing is not market timing. It is selling a little of what ran and buying a little of what lagged, on a schedule, not on a hunch.
📊 Market Statistics & Analysis
Weekly technical overview across key sectors, risk indicators, and market internals
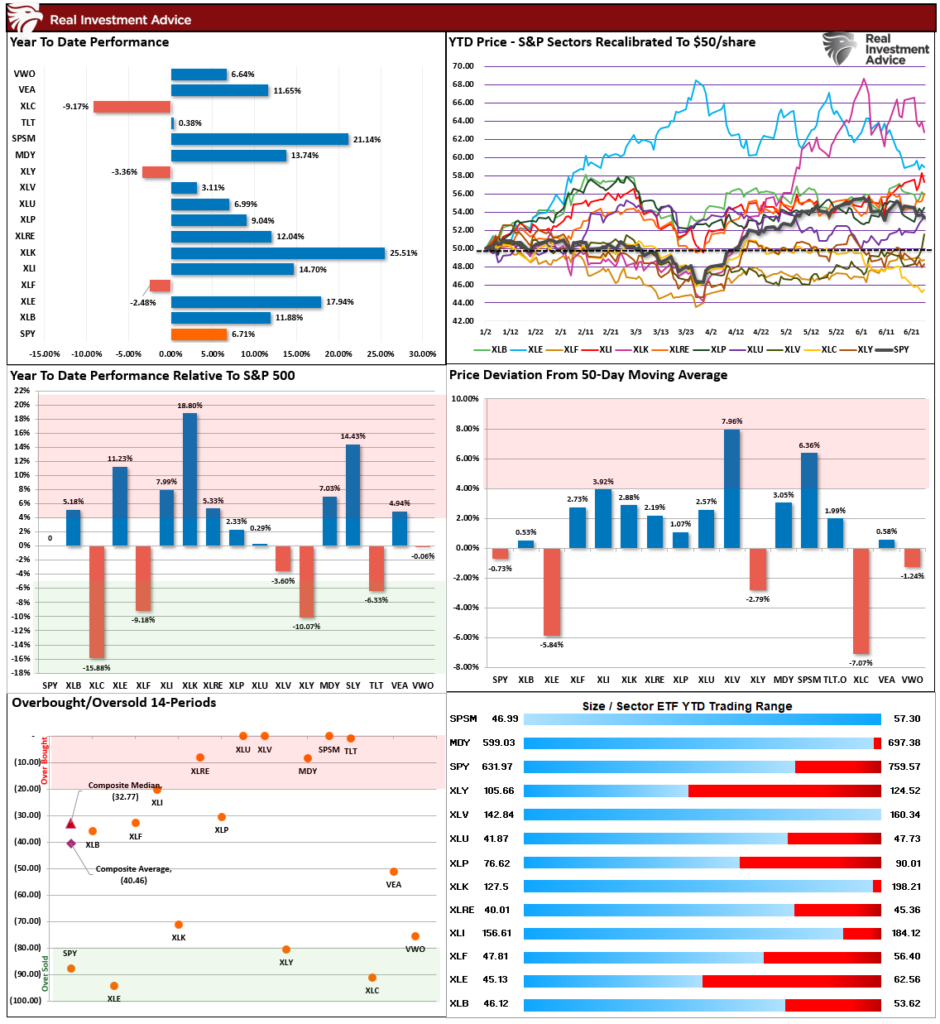
💸 Market & Sector X-Ray: Market Rebounds From 50-DMA
As noted last week, Technology remains the clear winner as Energy continues to give up a chunk of its YTD gains following the resolution with Iran. That market is not broadly overbought, but certain sectors are. As such, manage your exposure risk accordingly and take profits as needed.
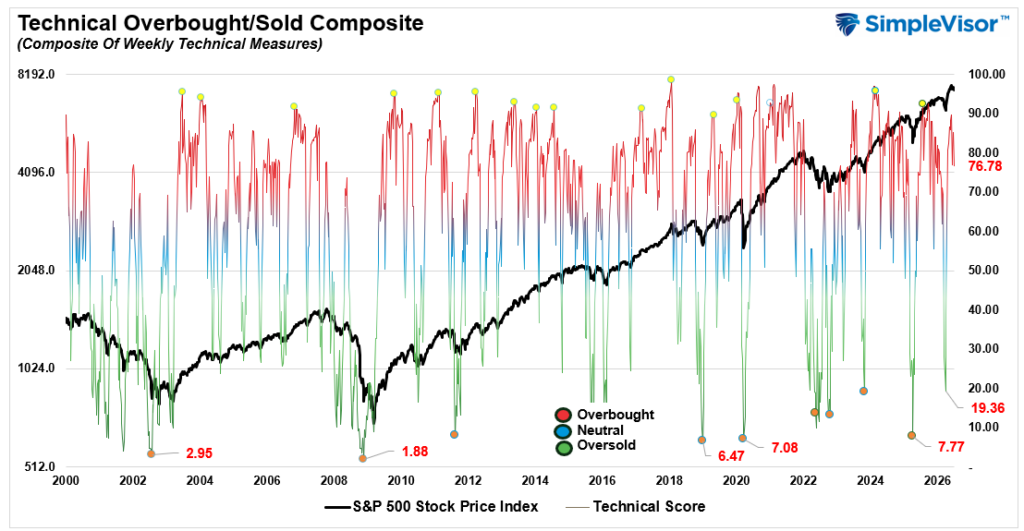
📐 Technical Composite: 76.78 – Still Overbought
As noted last week, “Technically, the market reset a small bit of its previously overbought condition, but remains stretched.” This past week, the market reversed a bit more of its more technically overbought condition but remains elevated. We could see a bit more weakness early next week as quarter-end rebalancing concludes.
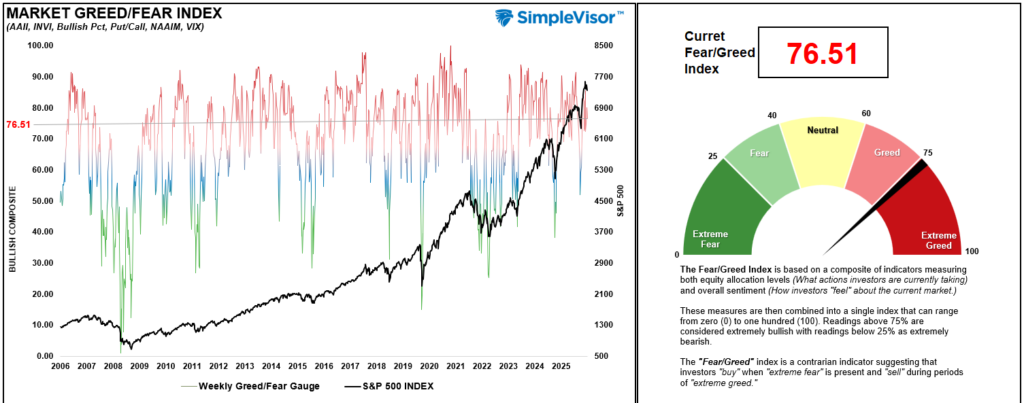
🤑 Fear/Greed Index: 76.51 – Despite Selloff – Greed Remains
Despite the selloff in Semiconductors this past week, and the level of greed did decline mildly, overall sentiment and positioning remain extreme, with professional investors now aggressively exposed to equities and retail positioning still high.
🔁 Relative Factor Performance
As noted in the main body of the commentary this week, the more extreme divergences inside market factors is likely setting up a rotation within the broader market. Not every sector will perform the same, but the setup between Momentum/Value (Semiconductors) to Megacap Technology stocks seems increasingly likely as we head into earnings season.
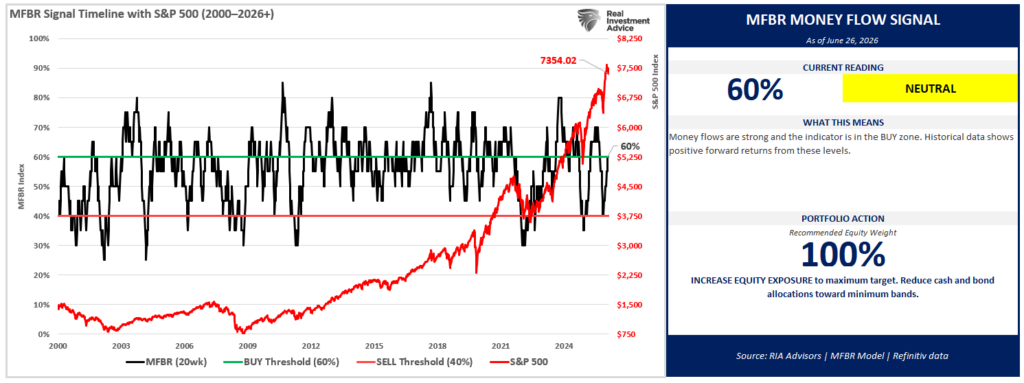
📊 MFBR Index (Money Flow/Breadth Ratio Indicator): 60% = Buy Zone
NEW! MFBR Index: The Money Flow Breadth Ratio (MFBR) model is a rules-based equity allocation framework that uses weekly S&P 500 money flow data to generate buy, sell, and neutral signals. The MFBR systematically adjusts portfolio equity exposure in response to the direction and persistence of institutional capital flows. It aims to reduce drawdowns while capturing the majority of market upside.
“As of June 26, 2026, with the S&P 500 at 7,354.02, the Money Flow Breadth Ratio (MFBR) stands at 60% and rising. This places the indicator in BUY territory (60-70%), triggering a NEUTRAL signal. The prior week reading was 60%, representing a 5% decline over the trailing four weeks.
The model currently recommends HOLDING exposure at 100%, a level that has remained since April 17, 2026 (10 weeks). This reflects a FLOW-OVERLAY OVERRIDE: the trailing 4-week net dollar flow has swung sharply positive (>$300B) after a deeply negative prior 4 weeks, a historically strong contrarian buy signal.”
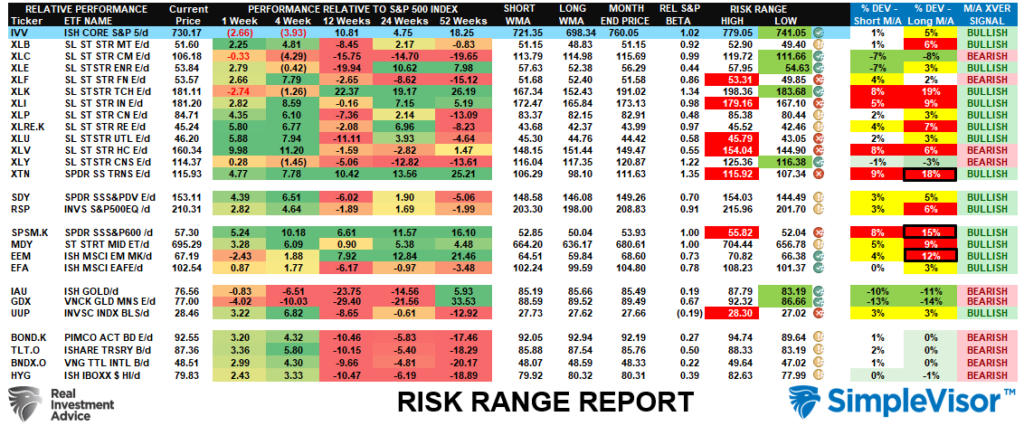
📊 Sector Model & Risk Ranges
As noted last week, “[Risk management] analysis remains the case this week.” The market struggled as the semiconductor trade came under pressure. With numerous sectors trading below the historical monthly norms from Communications, to Energy, Technology (Megacaps), and Discretionary, a rotation to those sectors is increasingly likely as we move into July. One note of concern is the rising number of longer-term bearish crossovers. While not a concern yet, if we see an increasing number of bearish crossovers from, such typically precedes more significant market corrections.

Comments
Log in or sign up to join the conversation.