

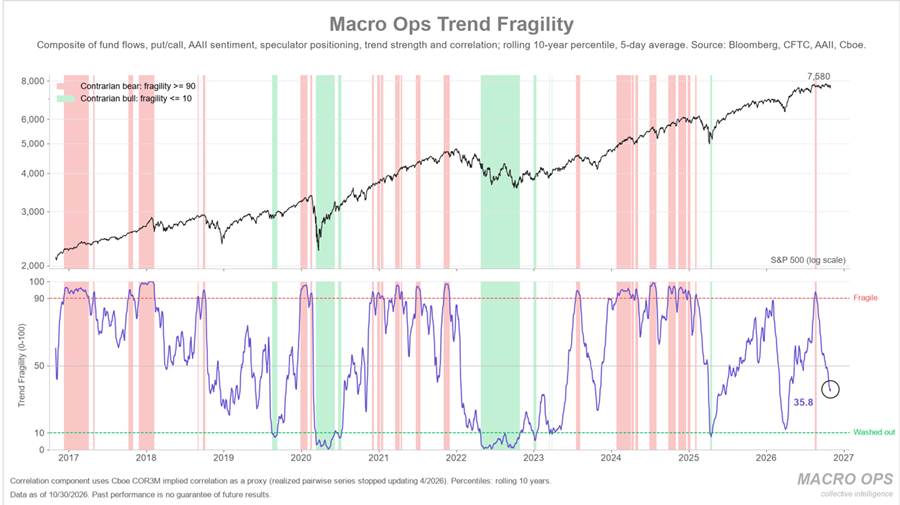
Summary: Funds have de-risked further, but gross remains elevated and retail still has its finger on the bid. Our Trend Fragility indicator is still neutral, with September’s sell signal intact. Total index put/calls haven’t spiked, so there’s still no sign of a capitulatory low. Credit is a mess and flashing anomalies, while the SPX sits in a rare compression regime. And the MO Breadth Divergence Aggregator is flashing a strong sell signal. On top of all that, we have midterms Tuesday and the prospect of a significant escalation in the Middle East after the vote.
This remains a low-conviction environment. Capital preservation comes first. I expect violent swings, both up and down, but the odds favor more downside until breadt and credit improve. I still like energy and natty gas, as well as some beaten down industrial plays.
MO Portfolio & Trades
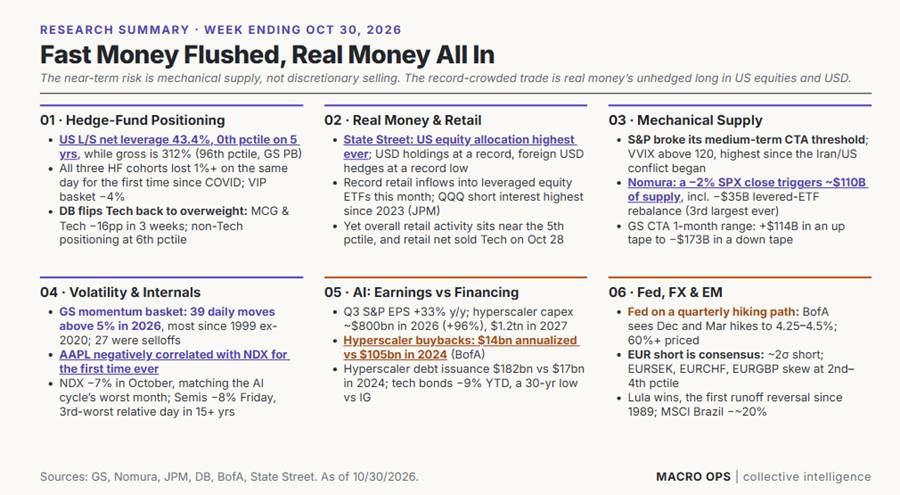
1. The portfolio rose +54bps last week and sits at +46.29% on the year, below our YTD high-water mark of +61%. We’re long Brent and heating oil futures, the BCOM Index, natural gas producers, GBP & AUD, a few miners and energy plays, and select biotech and healthcare plays. We’re short nasdaq, silver, soybeans, EUROSTOXX50, and continue to hold high levels of cash.
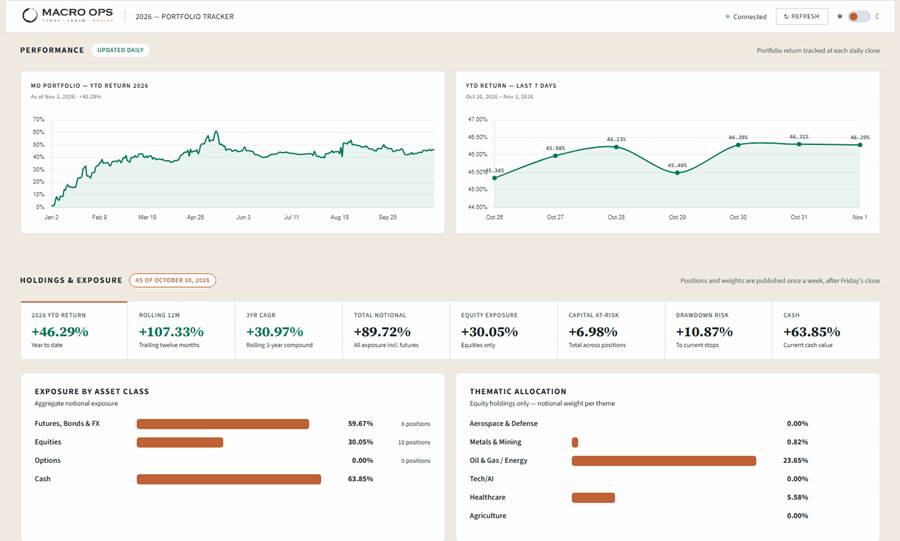
2. The week ahead in data. Apple reports Monday, then Tuesday’s midterms headline the week. Polymarket has Democrats at 94% to take the House and 69% for the Senate. Payrolls and a slate of Fed speakers close it out.
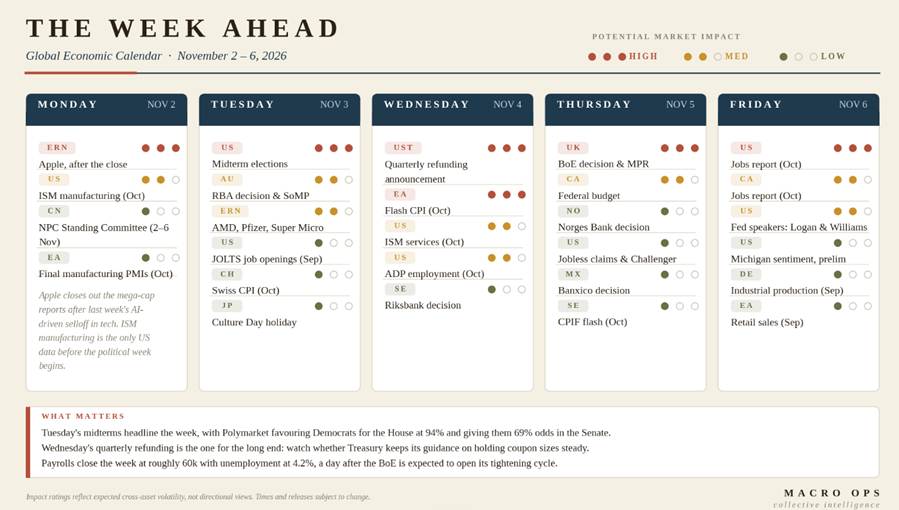
3. Research summary highlights: Hedge fund net exposure sits in the 0th percentile on a five-year lookback, while real money’s US equity and USD allocations are at records with hedges at record lows. Most of the near-term downside risk is mechanical: a −2% S&P close would trigger roughly $110bn of CTA, vol-control and leveraged-ETF selling. AI demand and earnings look intact. The debate has moved to financing, with hyperscaler buybacks collapsing, debt issuance surging and the Fed moving toward hikes in December and March
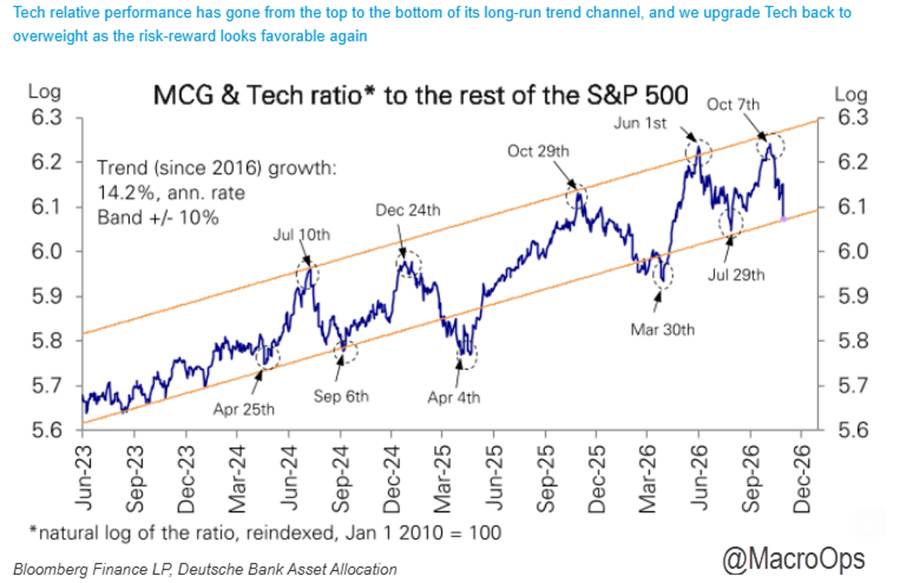
4. Update on the DB tech/SPX ratio chart from last week. It’s back at the bottom of its channel. The question is whether tech regains leadership by catching up, or the SPX catches down. I’m starting to lean toward the latter…
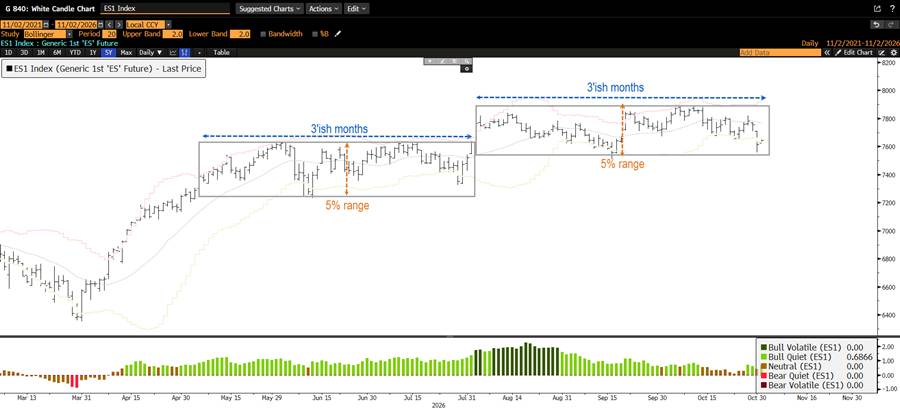
5. The SPX has traded in an incredibly narrow range for six months. Compression like this is highly unusual.
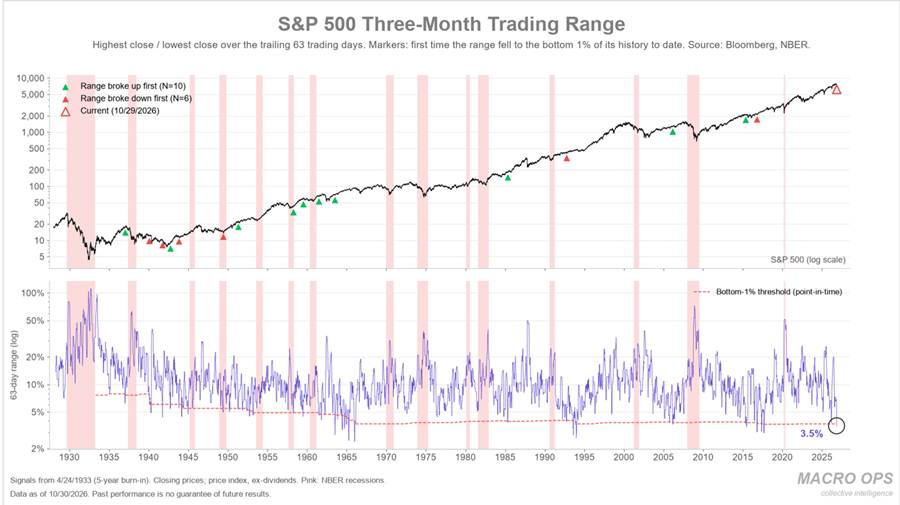
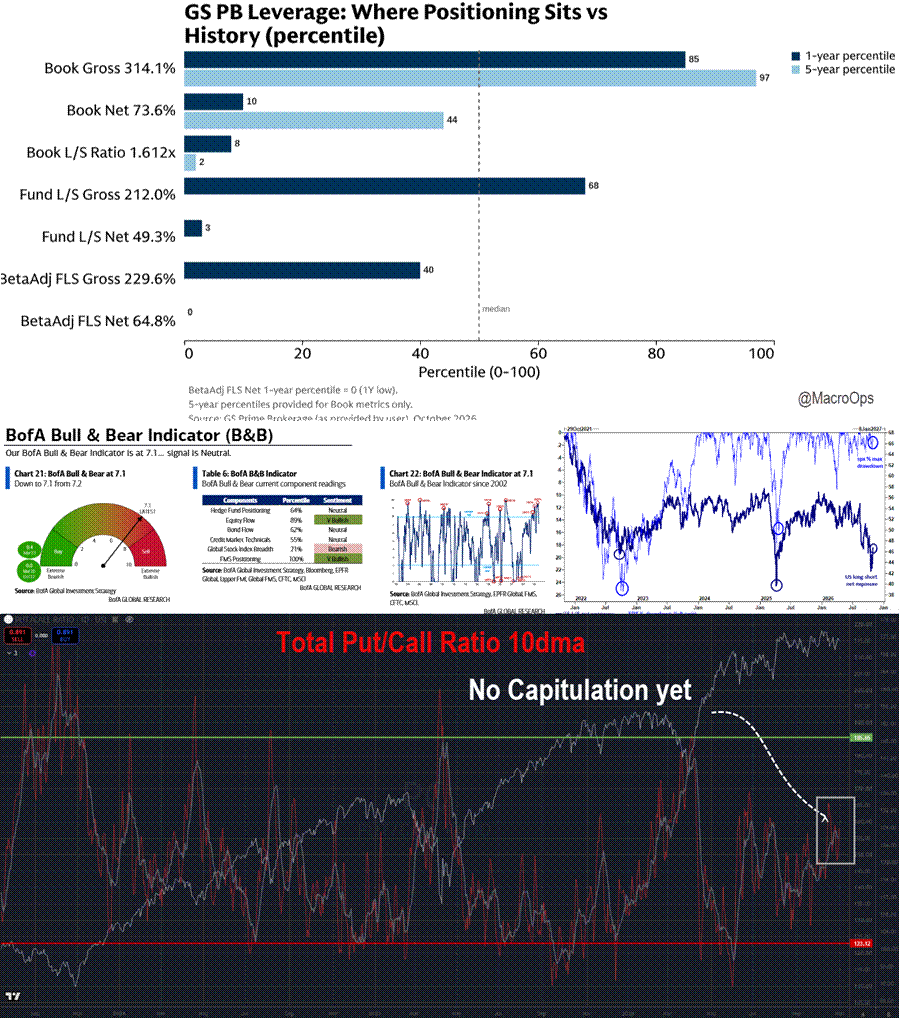
6. The current range is tighter than 99.4% of all three-month periods since 1928. It’s only the 17th time since 1933 that the range has dropped into the bottom 1% of its history.
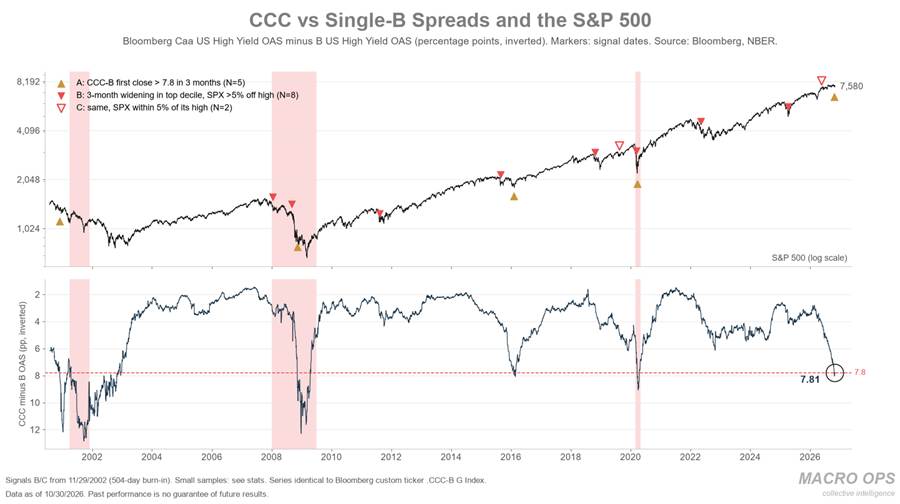
7. The anomalies in this market keep stacking up. CCC vs single-B spreads are at lows that typically coincide with recessionary bear market bottoms, while equities sit within spitting distance of all-time highs (h/t to someone on X where I saw this first, sorry I don’t recall who).
8. Funds have taken nets down significantly, and fundamental L/S funds cut gross at their fastest pace since ‘16 last week. Even so, overall gross remains elevated, in the 97th percentile on a five-year lookback and the 85th on one year. BofA’s Bull & Bear Indicator is still far from a contrarian buy signal, and smoothed total index put/calls are well below capitulation levels
9. Our Trend Fragility indicator, a composite of sentiment and positioning, gave a sell signal last month and has only fallen to 38. That’s well above the sub -10 reading needed to mark a full reset and a durable low.
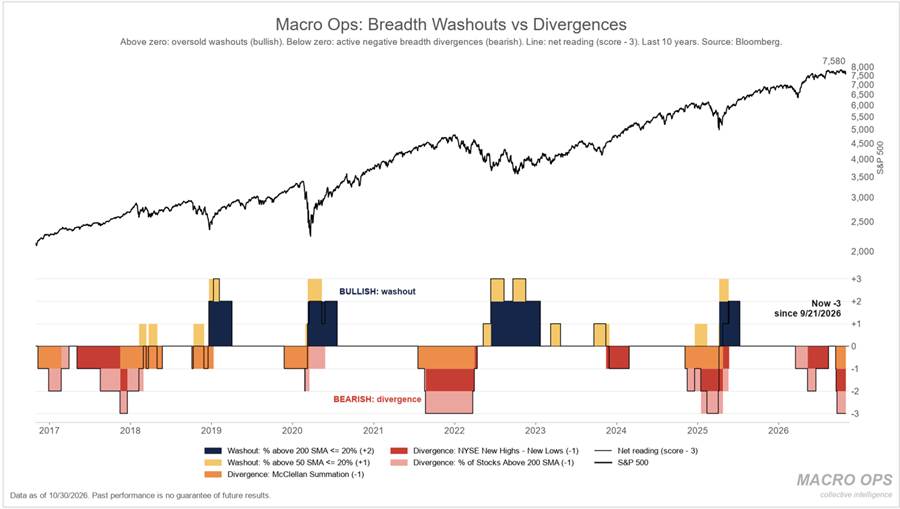
10. The MO Breadth Divergence Aggregator is at −3. The last three times it got this low: the run-up to the ‘25 Liberation Day selloff, late ‘21/early ‘22, and late ‘17 as the market ran into the Jan ‘18 blowoff top. That’s quite bearish. Odds favor a broader market shakeout until this improves meaningfully.
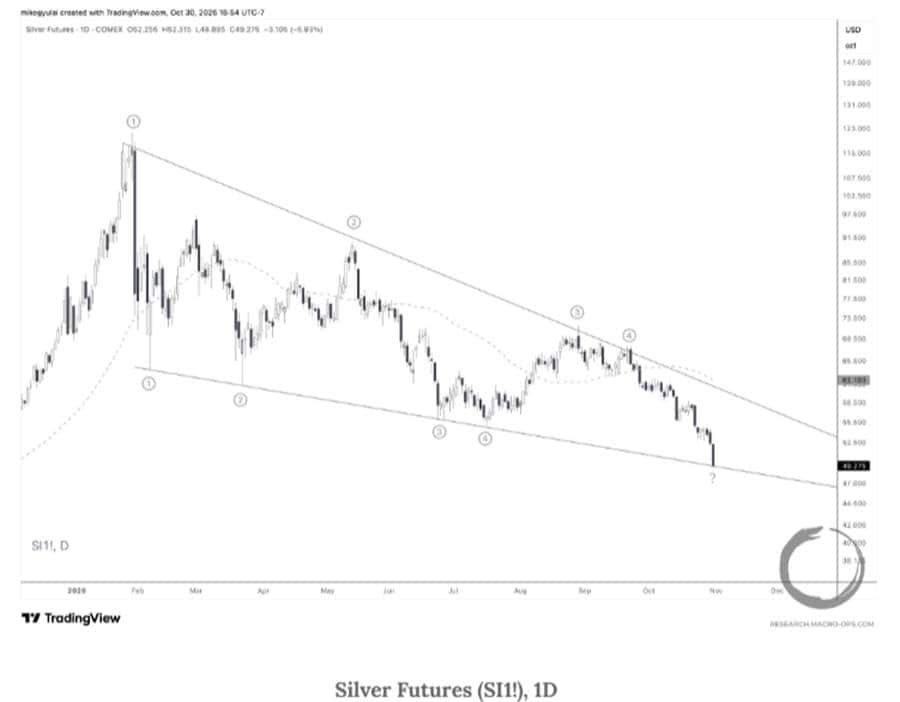
11. My teammate Mike G had some excellent charts in his latest weekly (link here). Here’s a daily of silver, which traded sub-$50 last week. We’ve been short since September and will take profits this week, with silver now at the lower rail of its falling wedge.
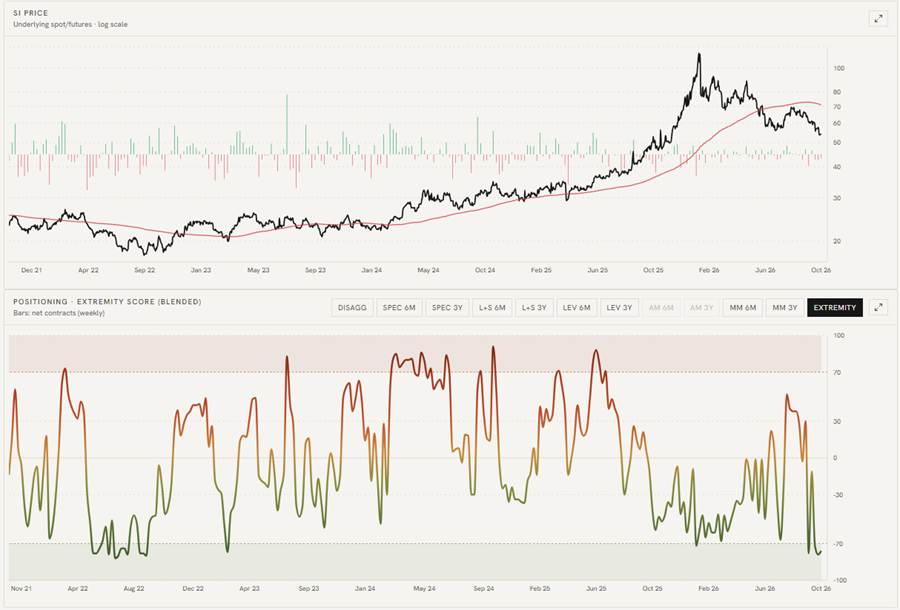
12. Positioning has also fully reset. I remain a long-term PM bull, and while I think a bullish setup is getting closer, I need to be patient and wait for signs the hiking cycle is over first.
13. I remain an energy bull. A material escalation in the Iran conflict looks increasingly likely after the midterms. I’ll be sharing an interview update with my intel contact, Mr. X, with Collective members very soon.
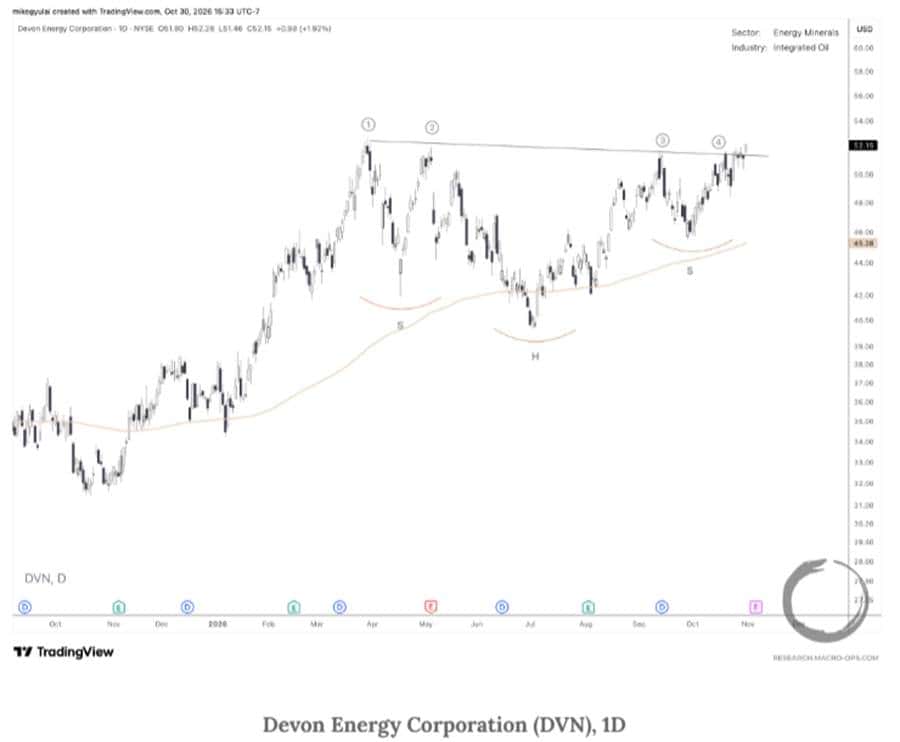
Here’s another great find from Mike: Devon Energy (DVN) completing a large inverse head-and-shoulders continuation pattern.
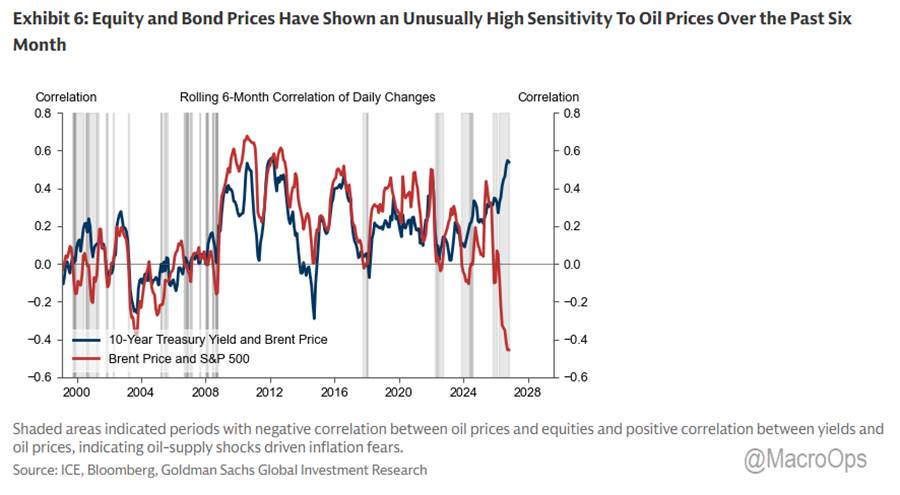
14. The price of oil is the key to markets right now. This great chart from GS shows equities and bonds have both been unusually sensitive to oil over the past six months. I don’t imagine a significant deterioration in the Middle East conflict will help either.

Comments
Log in or sign up to join the conversation.