

I keep searching for the signals that tell me the market is going to rally off these lows.

The Summation still shows nothing that indicates it is going to turn higher.

I said last week that I thought we were close to an uptrend. On Tuesday I thought we were seeing the first signs of life of the uptrend when the bullish percents actually started to tick higher.
But Friday's late selloff made it clear that the market was not ready.

It was another good sign when the number of new 52-week lows dropped down dramatically Friday morning. But later in the day, they started to pick up.

Even after all this selling, the 10-day call/put ratio is still trending lower.

The Long-Term Outlook
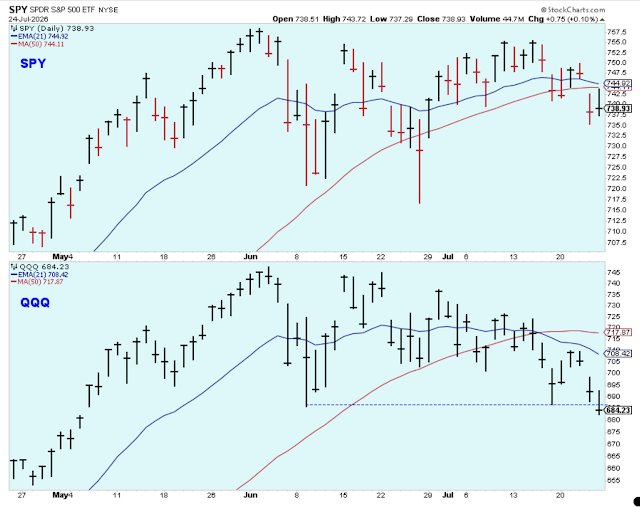
The SPX has broken down. The next target is the 2200-level, but major support is the 2016 range established just before the last election which is about 1900-2100.

When short-term rates head lower late in the cycle, it isn't a good sign for stocks. But this is a terrible health scare so I'm not sure the circumstances can be fairly compared to the past.

The SOXX index looked invincible a few weeks ago, but there was a warning that it was vulnerable based on this correlation with the Chinese market which was rolling over. I mentioned it a few times in this blog but I didn't pay attention to my own comments.

The larger trend for Semiconductors is still holding above trend. What a beautiful chart this is. This is one of the most important charts to be watching.

The ECRI index looks like it is about to break down below the -5 level where a recession is likely.

One last chart. Here is a look at the 2-year weekly PMO for the broad market. I think this tells us that the market needs time to bottom out.

My accounts are mostly in cash. I made a few attempts to buy some bargains, but I was fighting with the market so I came to my senses and got out. It was a rookie mistake.
Below is the spreadsheet I use to keep track of the market's sector strength. It is so interesting to see Technology as the leading sector. This group is now both risk-on for growth and risk-off for safety.
Treasury bonds are clearly the outperformers. Not shown in the spreadsheet are gold, volatility and bear market ETFs which also strong performers.
The green ticks higher are a bit surprising. Small Caps and Financials found a little strength compared to the other ETFs.

Outlook Summary
Equities (10%), Cash (90%).Looking for signs of the next short-term uptrend.
The long-term outlook is negative as of March 20.
The short-term trend is down as of Feb. 21.
Contrarian Sentiment favors higher prices as of Feb. 7 (34.6% Bulls).
The medium-term trend for Treasury bonds is up as of Jan. 25 (prices higher, yields lower)
Strategy During a Bull Market
- Buy large-cap stocks and ETFs at the lows of the medium or short-term market trends.
- Buy small-cap growth-stocks on breaks to new highs in the early stages of market trends.
- Reduce buying when the market trend is at the top of the range.
- Take partial profits when the market uptrend starts to struggle at the highs
Trader Discipline
- Never invest based on personal politics
- Take pride in sticking to the trading plan
- Don't give in to fear and greed
- Never get angry

Comments
Log in or sign up to join the conversation.