

Starbucks Corporation (SBUX) is an American multinational chain of coffeehouses and roastery reserves. It is the world’s largest coffeehouse chain. As of November 2021, the company had 33,833 stores in 80 countries, 15,444 of which were located in the United States. Out of Starbucks’ U.S.-based stores, over 8,900 are company-operated, while the remainder are licensed.
Starbucks Daily Chart
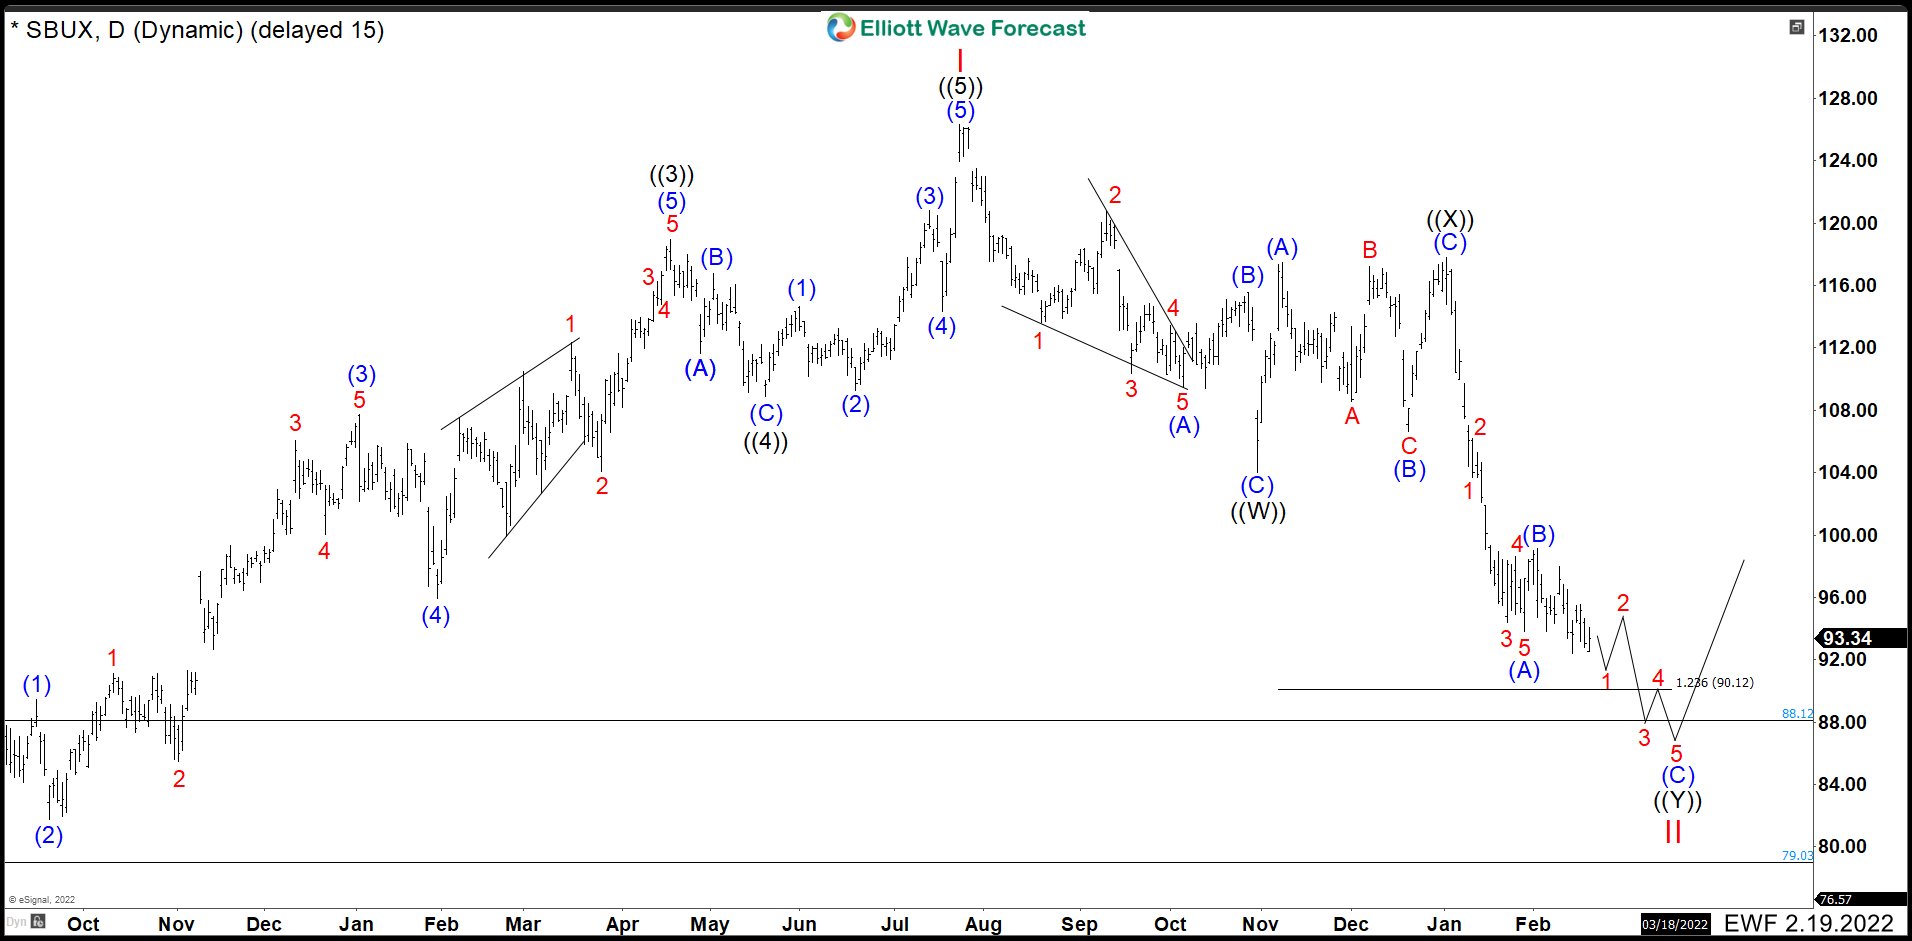
Starbucks completed an impulse structure from March 2020 low. It topped at $126.32 on July 2021. At that price, the stock started a correction of the cycle from March 2020.
We can see a double correction form from the peak, which appears as a ((W)), ((X)) and ((Y)) structure, where each one is formed by 3 waves (A), (B), and (C). The first 3 waves of ((W)) ended at the 104.02 level. From there, we can see a pullback in 3 waves, which ended ((X)) at the 117.80 level.
From there, we should see 3 more swings down to complete the double correction. Wave (A) made an impulse ending at the 93.79 level before wave (B) completed a shallow correction at 99.15. We are already in wave (C), and we are expecting to see more downside as we look for an impulse structure.
This drop should end below $90.12 and it should not go any further down than $79.03. Keep an eye on the stock when the 5-waves structure finishes because SBUX should continue to rally after that.


Comments
Log in or sign up to join the conversation.