

In this technical blog, we will look at the past performance of 1 hour Elliott Wave Charts of SPY, which we presented to members of the Elliott Wave Forecast.
In which, the rally from 27 January 2021 low unfolded as an impulse structure. And showed a higher high sequence favored more upside extension to take place. Therefore, we advised members not to sell the ETF & buy the dips in 3, 7, or 11 swings at the blue box areas. We will explain the structure & forecast below:
SPY 1 Hour Elliott Wave Chart
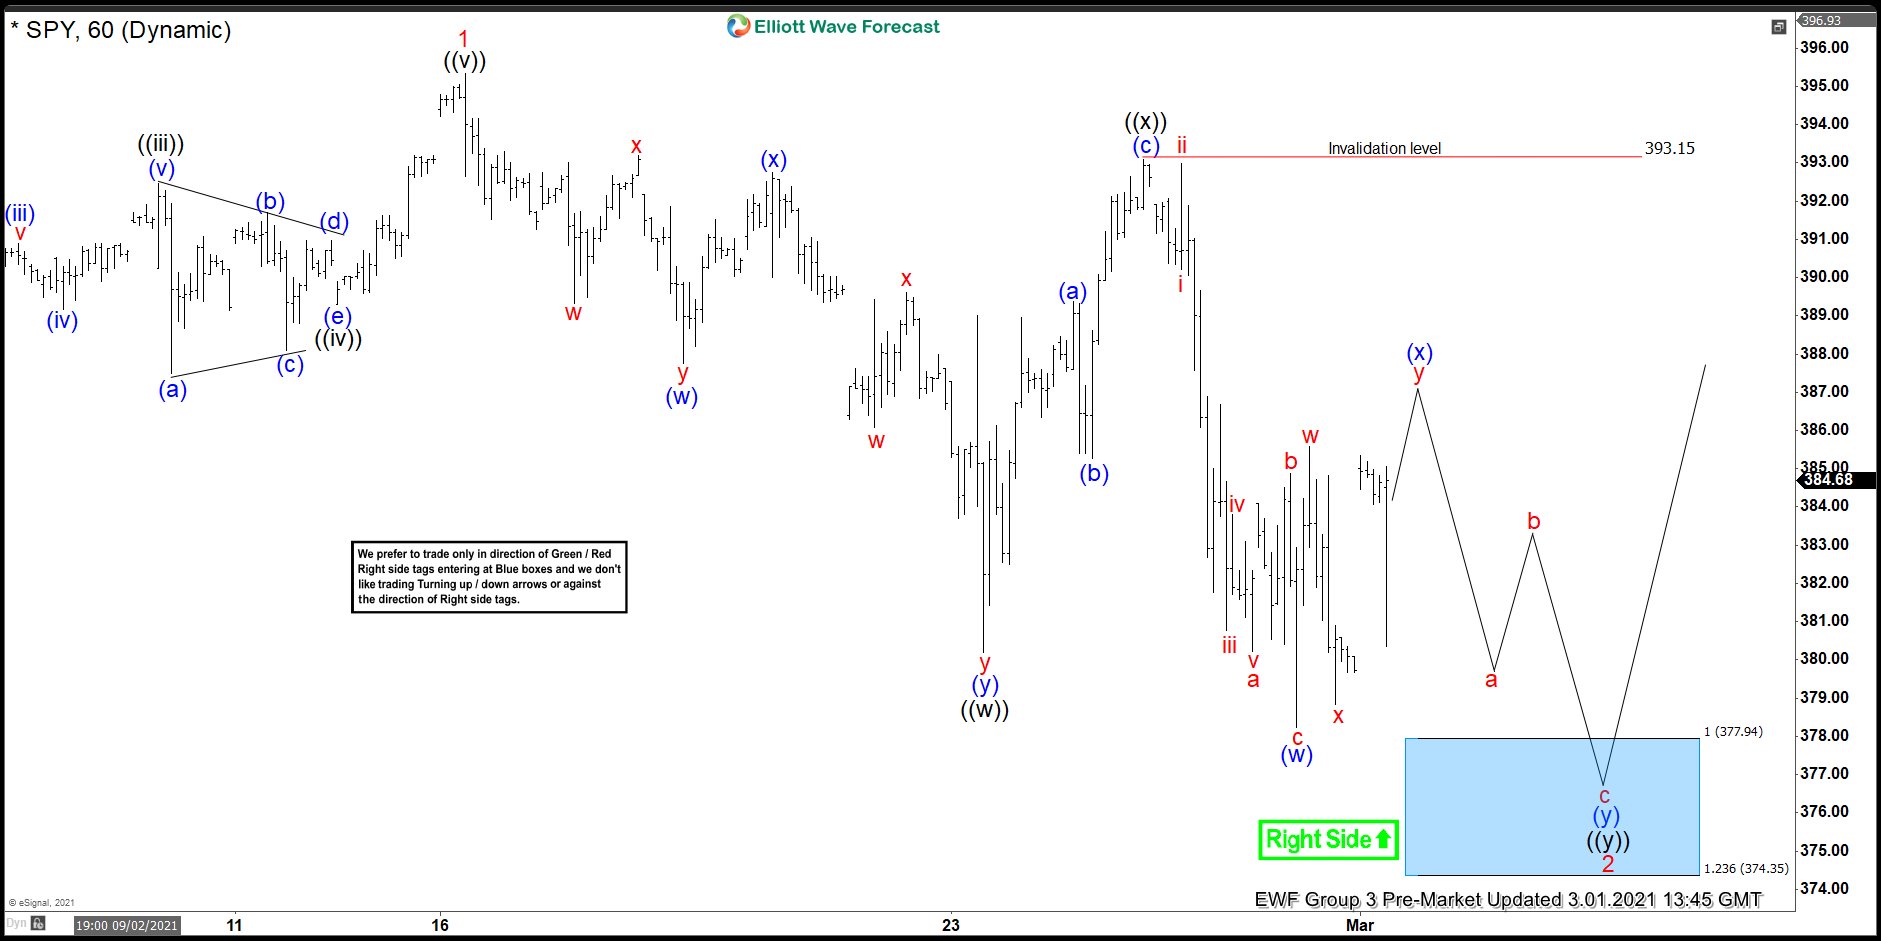
Above is the 1 hour Elliott wave Chart of SPY from the 3/01/2021 Pre-Market update. In which, the SPY ended the 5 wave impulse rally in wave 1 at $395.35 high. Down from there, the ETF made a pullback in wave 2. The internals of that pullback unfolded as a double three structure where wave ((w)) ended at $380.20 low. Wave ((x)) bounce ended in 3 swings at $393.10 high and wave ((y)) was expected to reach the $377.97- $368.59 100%-161.8% Fibonacci extension area of ((w))-((x)). From there, buyers were expected to appear looking for further upside.
SPY 1 Hour Elliott Wave Chart
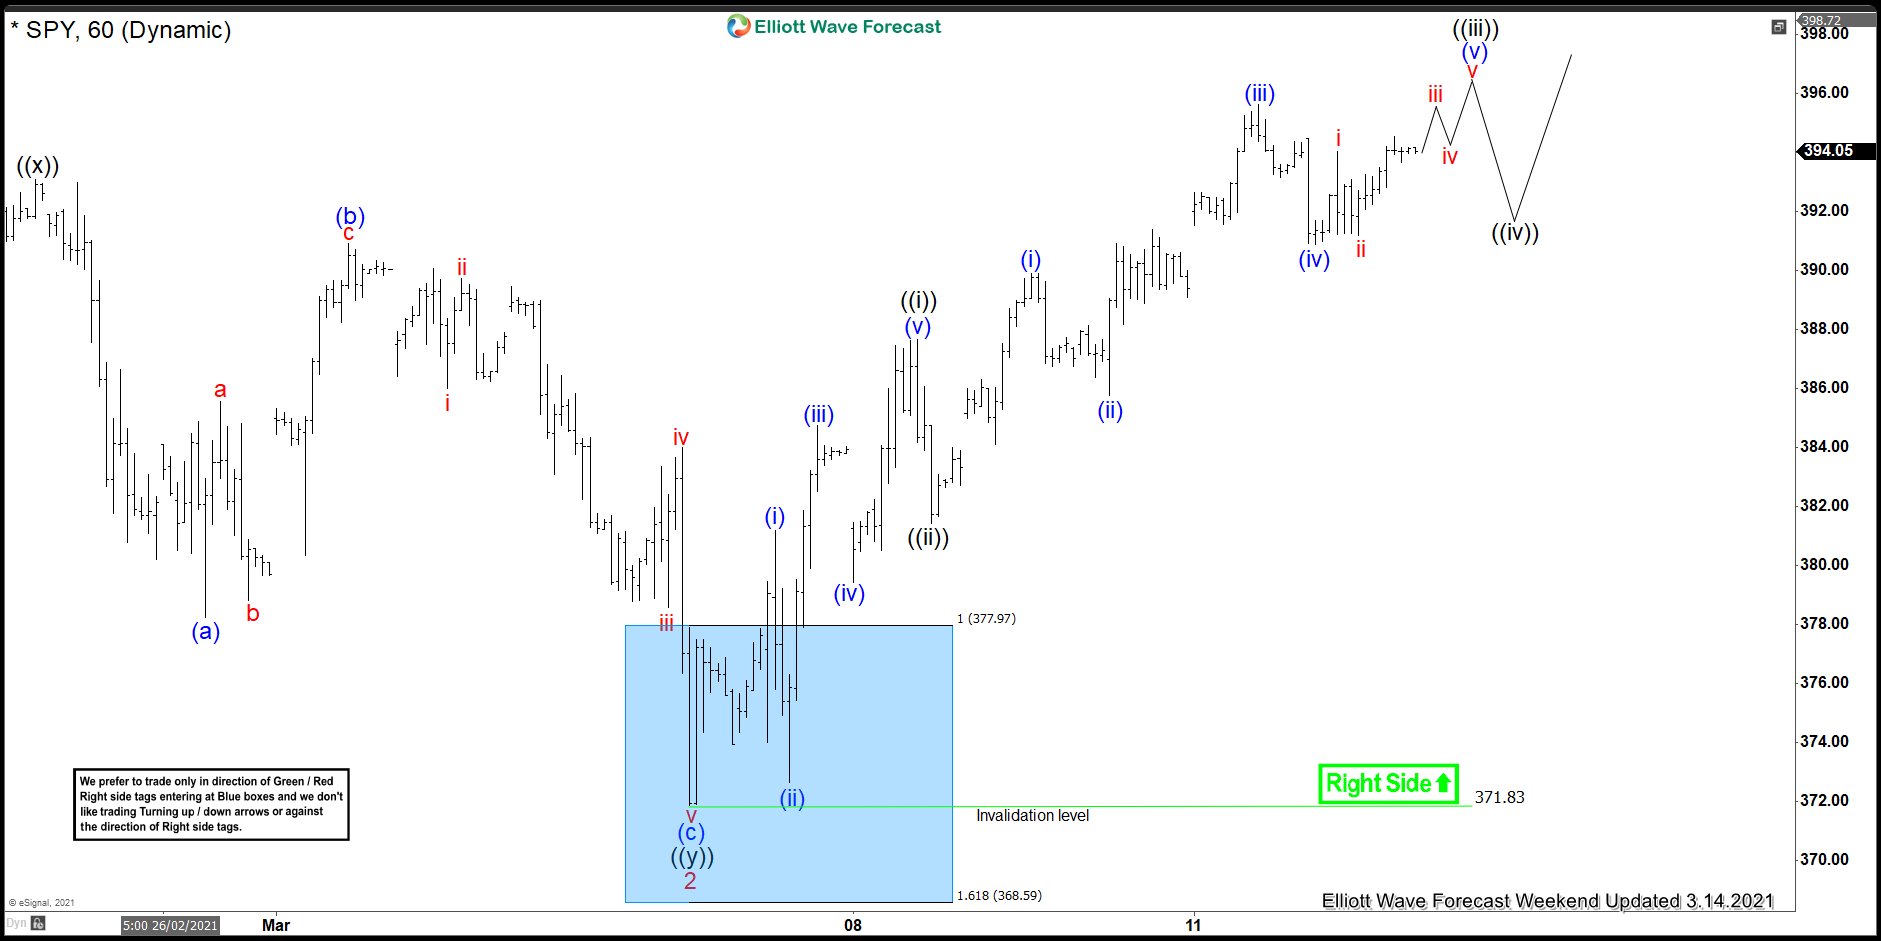
Here’s the 1 Hour Elliott wave Chart of SPY from the 3/14/2021 Weekend update. In which, the ETF managed to reach the blue box area at $377.97- $368.59 & showing a strong reaction higher taking place from the blue box area. Right after ending the double three correction within the blue box area at $371.83 low. And breaking to new highs as expected. This allowed Elliot Wave Forecast members to create a risk-free position shortly after taking the long positions at the blue box area.



Comments
Log in or sign up to join the conversation.