

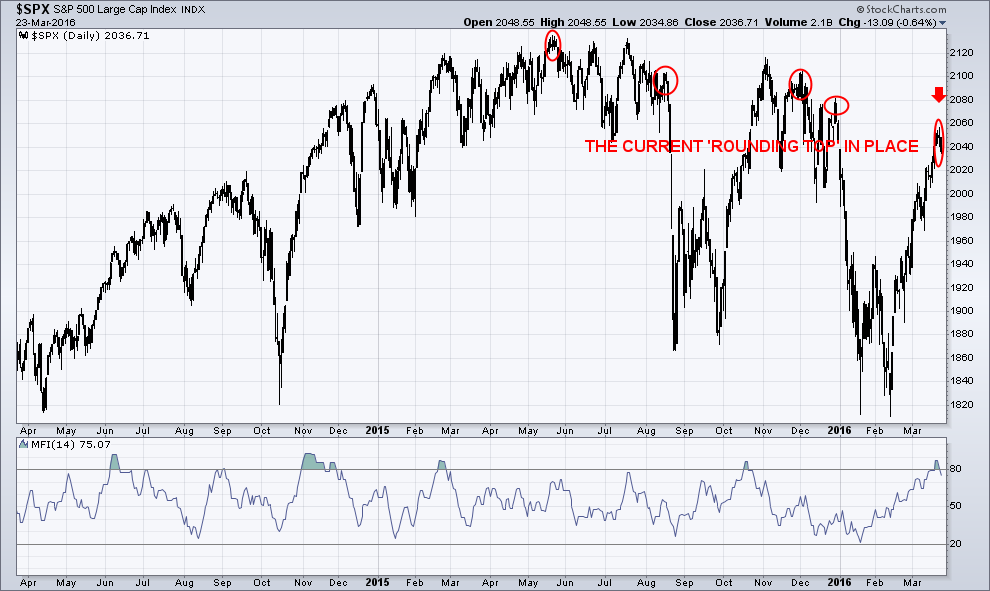
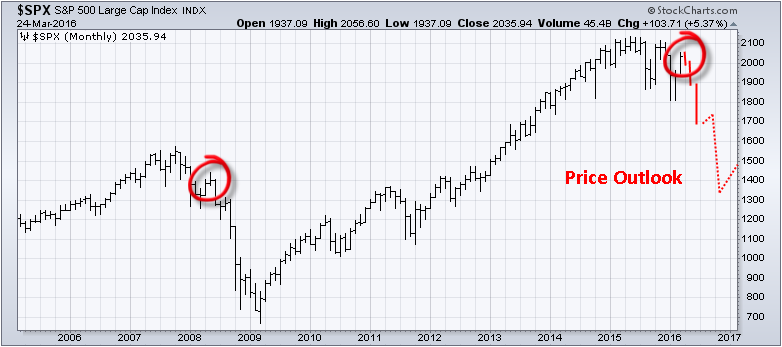
The SPX at the 2050 level looks like a great place for a ‘pullback’ to begin as indicated in the chart below. There is a potential “distribution topping phase” in which the SPX may pull back to 2000. I see a potential target at 1890.
The price has made a series of lower swing highs and lower swing lows since topping in 2015.There was a big August 2015 sell-off, followed by a rally to a lower high in November 2015, then a sell-off to a lower low in January 2016.The rally currently is still at a lower high than the November 2015 high.
Based on data, provided by Investor Intelligence, the bulls are up to 47.4% and the bears are down to 27.8%. This data has been collected from a survey of newsletter writers and investor advisors.This sentiment has changed very quickly and now points to an ‘exhaustion inflection point’ in the SPX.This is a rare and excess ‘swing’ of sentiment within a very brief period of time. It is reflecting that this move upwards is ‘unsustainable’!
A topping phase has now started, but know we could see slightly higher highs during this choppy process.
(Click on image to enlarge)
(Click on image to enlarge)
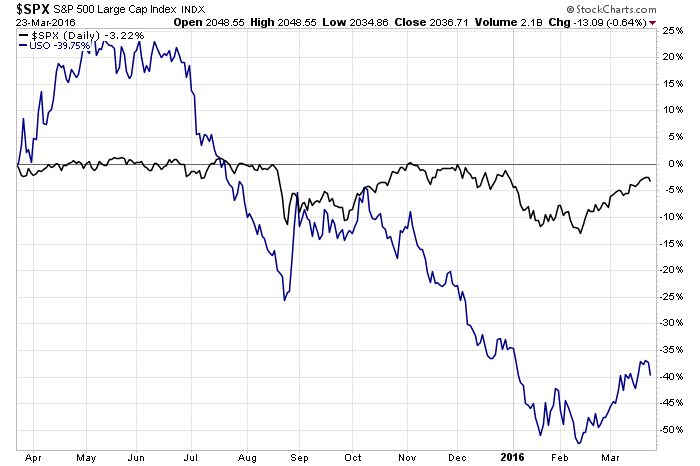
Crude Oil and SPX Comparison Chart:
As long as the WTI Oil does not rally, the SPX will continue its’ decline.
SPX and Oil Trading Conclusion:
I feel oil will hold up and bounce for a couple more weeks and help support the stock market. But once stocks lose their upward momentum and oil starts to fall again – look out below!


Comments
Log in or sign up to join the conversation.