

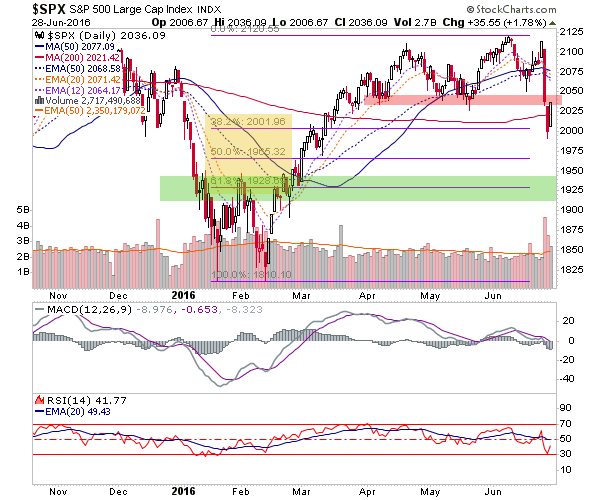
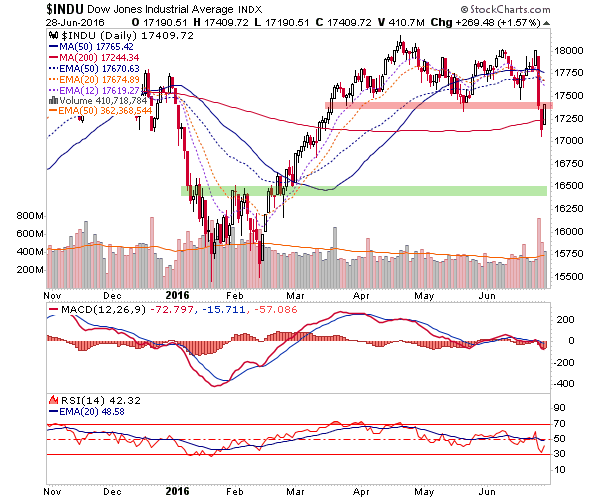
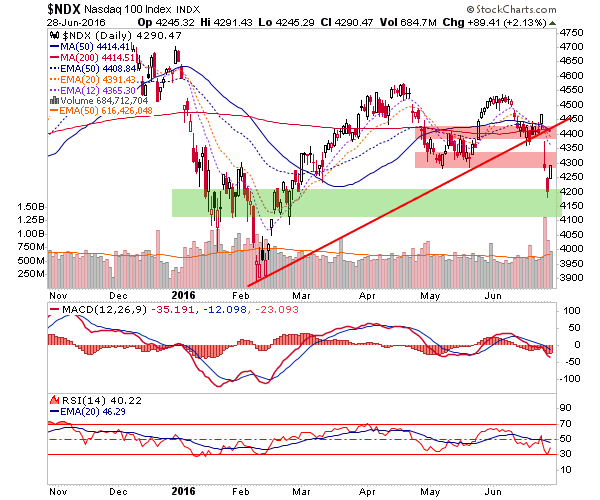
Sometimes simpler is better. The four charts below were twice used in subscriber updates at nftrh.com to gauge the expected relief bounce in US markets; first to establish bounce parameters in pre-market and later updated, as of yesterday's close.
The S&P 500 is at resistance. More resistance comes into play at the 50 day moving averages at around 2075. That is the ultimate gateway the market needs to pass through in order to undo the damage of Friday and Monday. If the market does not negate the damage, we would look forward to lower Fib retrace levels, extending as far down as 1925.
The Dow is very similar and the parameters assigned to SPX can be applied here.
The Nasdaq 100 has been a real weakling for some time now as it has established a series of lower highs and lower lows. Current resistance is around 4300 and stiffer resistance is at the broken trend line, the moving average cluster and lateral resistance at and around 4400.
But our key market (due to a positive fundamental view, which is beyond the scope of this TA post), the Semiconductor index, remains in a series of higher highs and higher lows. In other words, unlike the NDX, it is intact. The question, as with the indexes above, is where will support have been found once the market's corrective process is over? Was the 640 area it, or will there be a decline (and in my opinion, significant buying opportunity) to 600? It is worth noting that the February low was a successful test of long-term support going back to early last decade.
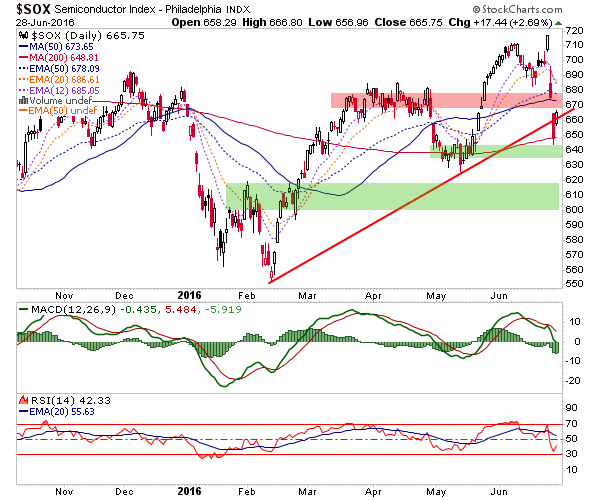
Sometimes I like to just get my TA on, keep it simple and interpret some pictures, free of the noise the likes of which permeated the markets over the last two weeks.



Comments
Log in or sign up to join the conversation.