
In all the excitement between the Italian crisis and the US lashing out with tariffs to be levied against our allies, it was easy to overlook this event:
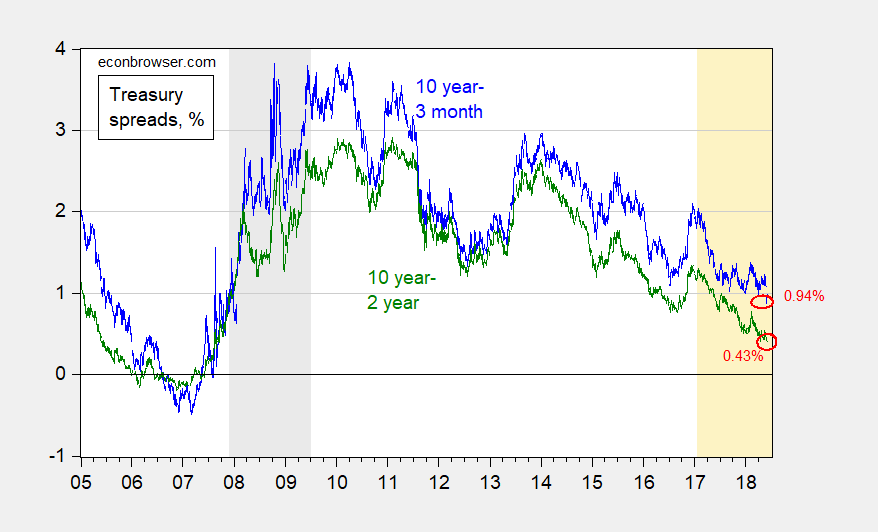
Figure 1: Ten year constant maturity Treasury minus three month Treasury bill yield spread on secondary market (blue), and ten year minus two year yield spread (green), both daily, %. Last observation is 6/1. Source: Federal Reserve via FRED, Bloomberg, and author’s calculations.
The 10year-3month spread broke through 1%, to 0.9%, while the 10year-2year spread plumbed new depths, to 0.4%. As the graph indicates, the last time around in 2005, this event presaged the onset of a recession about 2 and a half years later. As I noted in an earlier post, about three of the six times that this has happened in US post-war history, a recession has not occurred.
Was this a special event, driven by once-off factors? The spread dropped on 5/29 as the ten year dropped, likely because of safe haven effects. This point is highlighted by Figure 2, which shows the VIX against the spread.

Figure 2: Ten year constant maturity Treasury minus three month Treasury bill yield spread on secondary market (blue, left scale), VIX (red, right scale). Source: Federal Reserve via FRED, Bloomberg, and author’s calculations.
Note, however, that by 6/1 the VIX had returned to more normal levels, and yet the spread remained at 1%. In other words, the spreads continue their downward march.
Using data through March and a formal model, the probability of a recession within of 12 months of March was 30%. Presumably for the 12 months from May, the probability is higher.


Comments
Log in or sign up to join the conversation.