

Hello everyone. In today’s article, we will look at the past performance of the 4H Hour Elliott Wave chart of SPDR Metals & Mining ETF ($XME). The rally from 5.31.2023 low unfolded as 5 waves impulse. So, we expected the pullback to unfold in 7 swings and find buyers again. We will explain the structure & forecast below:
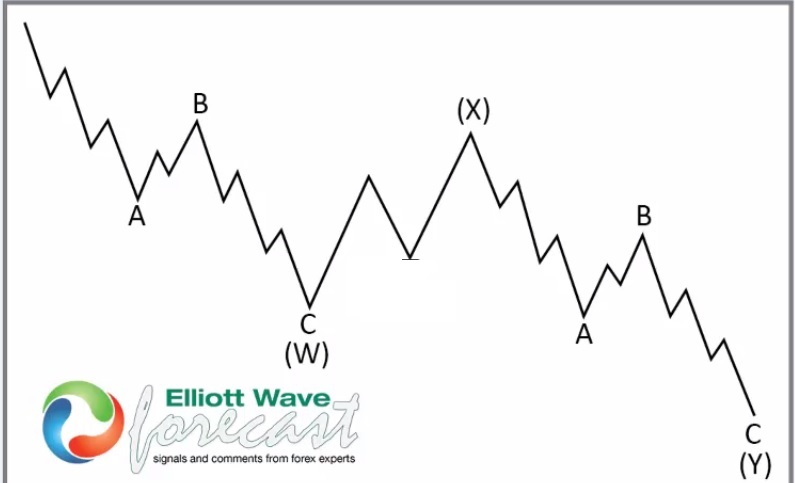
7 Swings WXY correction
$XME 4H Elliott Wave Chart 8.05.2024:
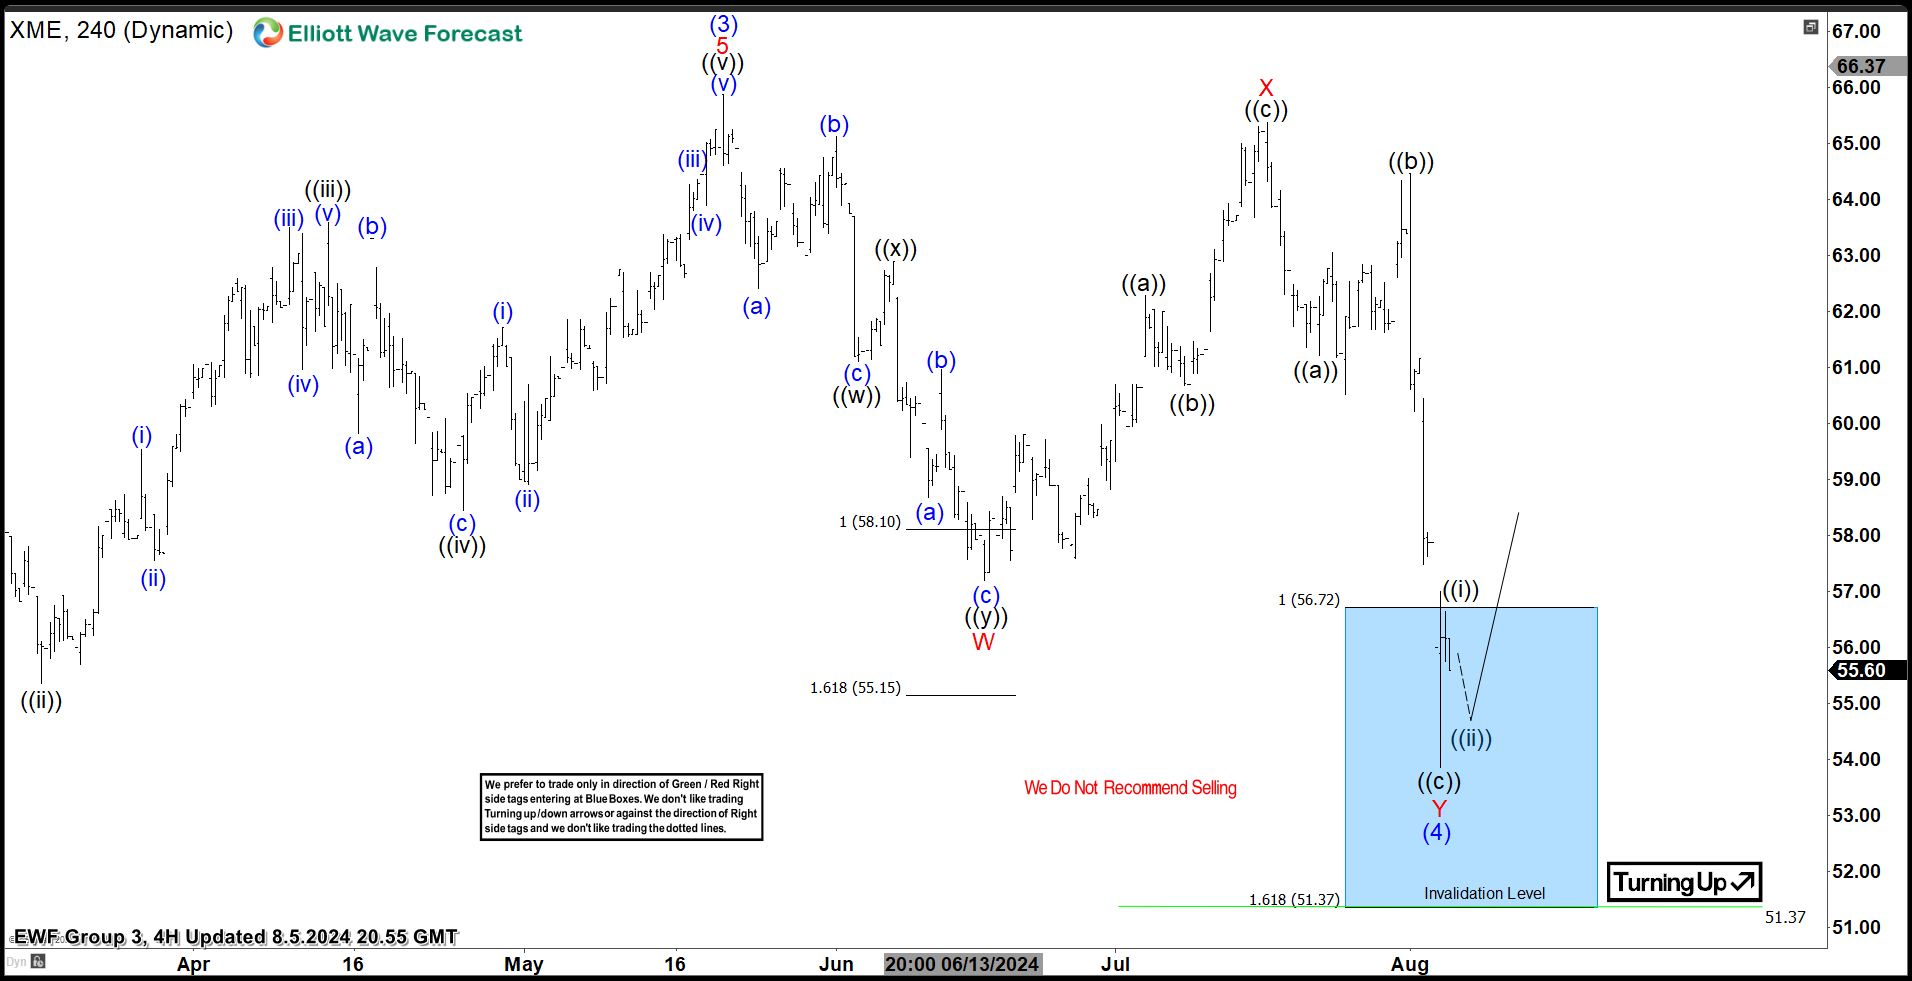 Here is the 4H Elliott Wave count from 8.05.2024. The 5 wave impulsive cycle from 5.31.2023 ended on 5.21.2024 at blue (3) and started a pullback. We expected the pullback to find buyers at the blue box area at 56.72 – 51.37 in 7 swings.
$XME 4H Elliott Wave Chart 8.11.2024:
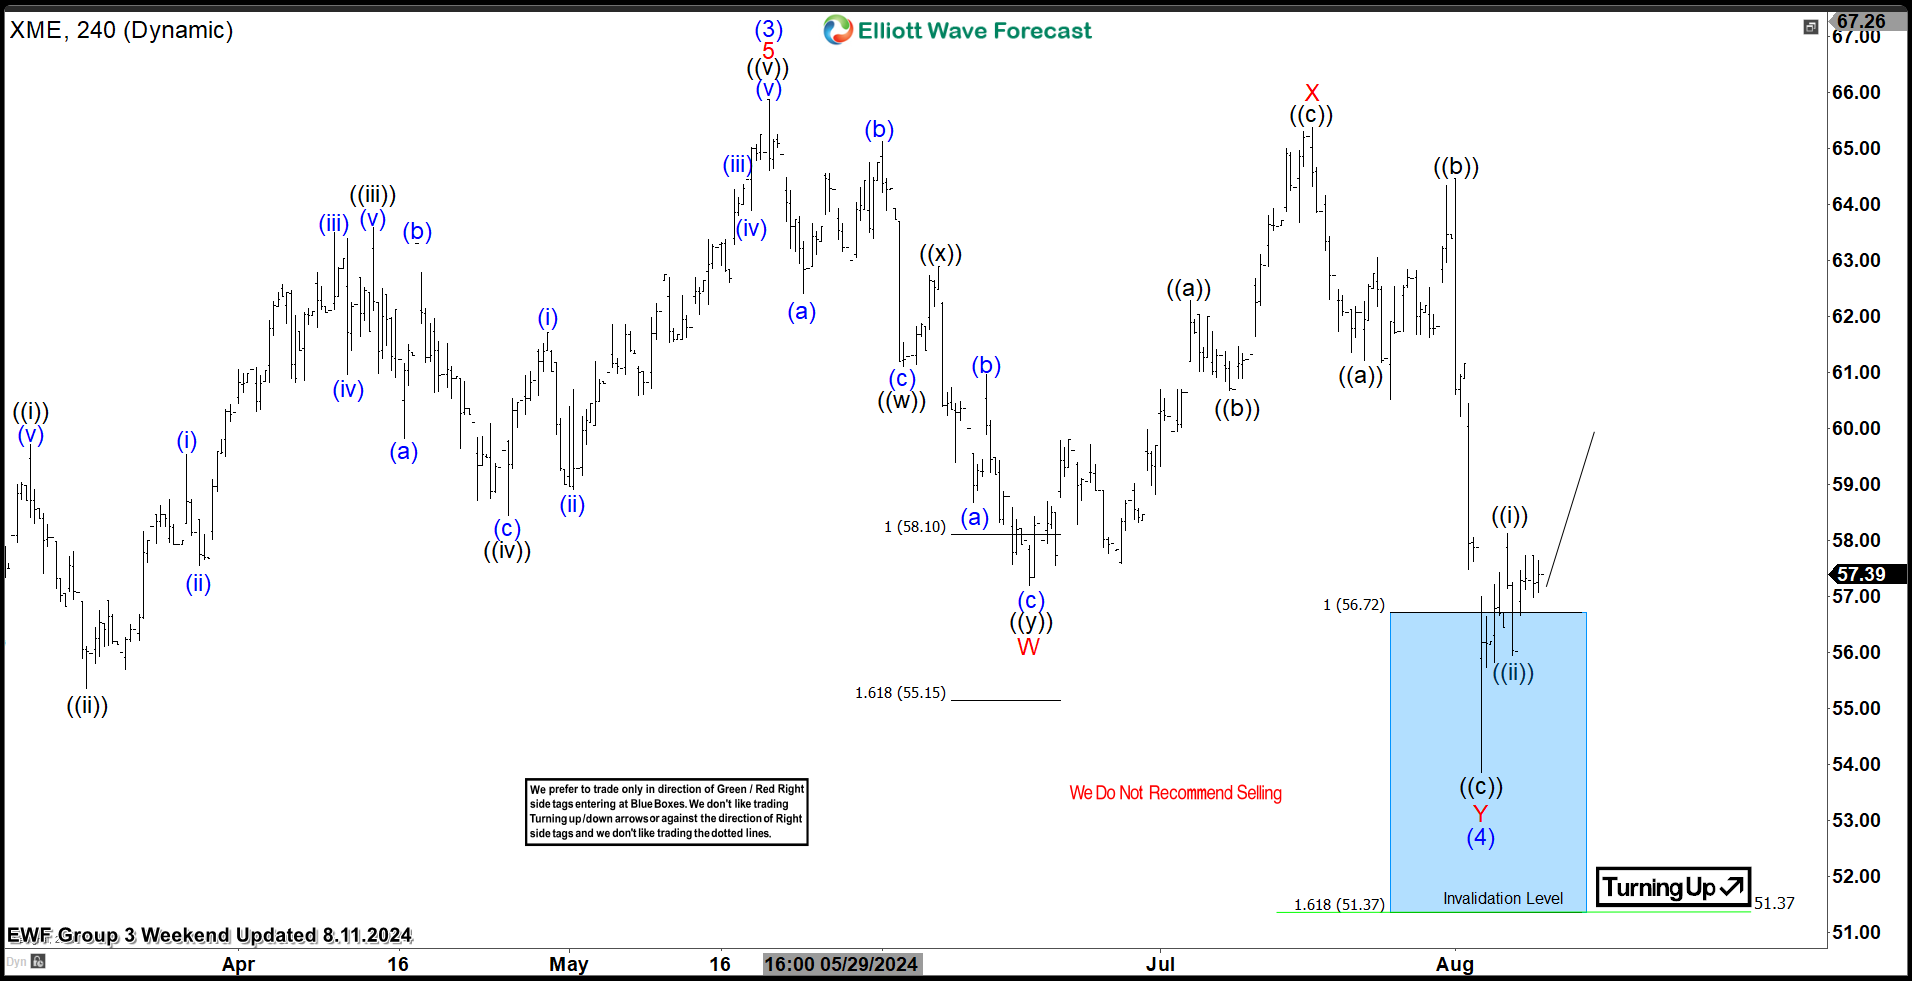 Here is the latest 4H update from 8.11.2024, showing the bounce taking place as expected. The cycle from the peak at red X has ended and the ETF has reacted higher from the blue box area allowing longs to get risk free. The ETF is expected to remain supported with a target area towards $68 – 72 area before another pullback can happen. Alternatively, the bounce can fail and continue lower in a 11 swings correction so chasing now can be risky. A break of blue (3) high will confirm the next leg higher and negate the possibility of a double correction.
Source: https://elliottwave-forecast.com/stock-market/spdr-metals-mining-etf-xme-reaction-blue-box/



Comments
Log in or sign up to join the conversation.