

Hello everyone. In today’s article, we will look at the past performance of the 1H Hour Elliott Wave chart of SPDR Industrial ETF ($XLI) . The rally from 5.02.2024 low at $120.56 unfolded as 5 waves impulse. So, we expected the pullback to unfold in 7 swings and find buyers again. We will explain the structure & forecast below:
7 Swings WXY correction
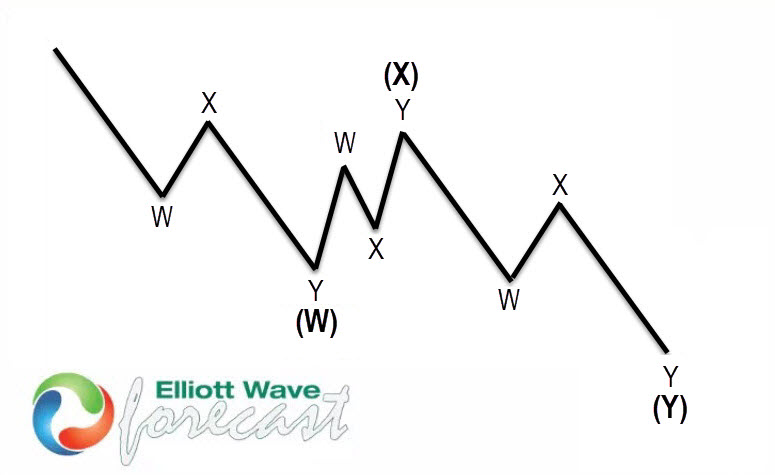
$XLI 1H Elliott Wave Chart 5.17.2024:
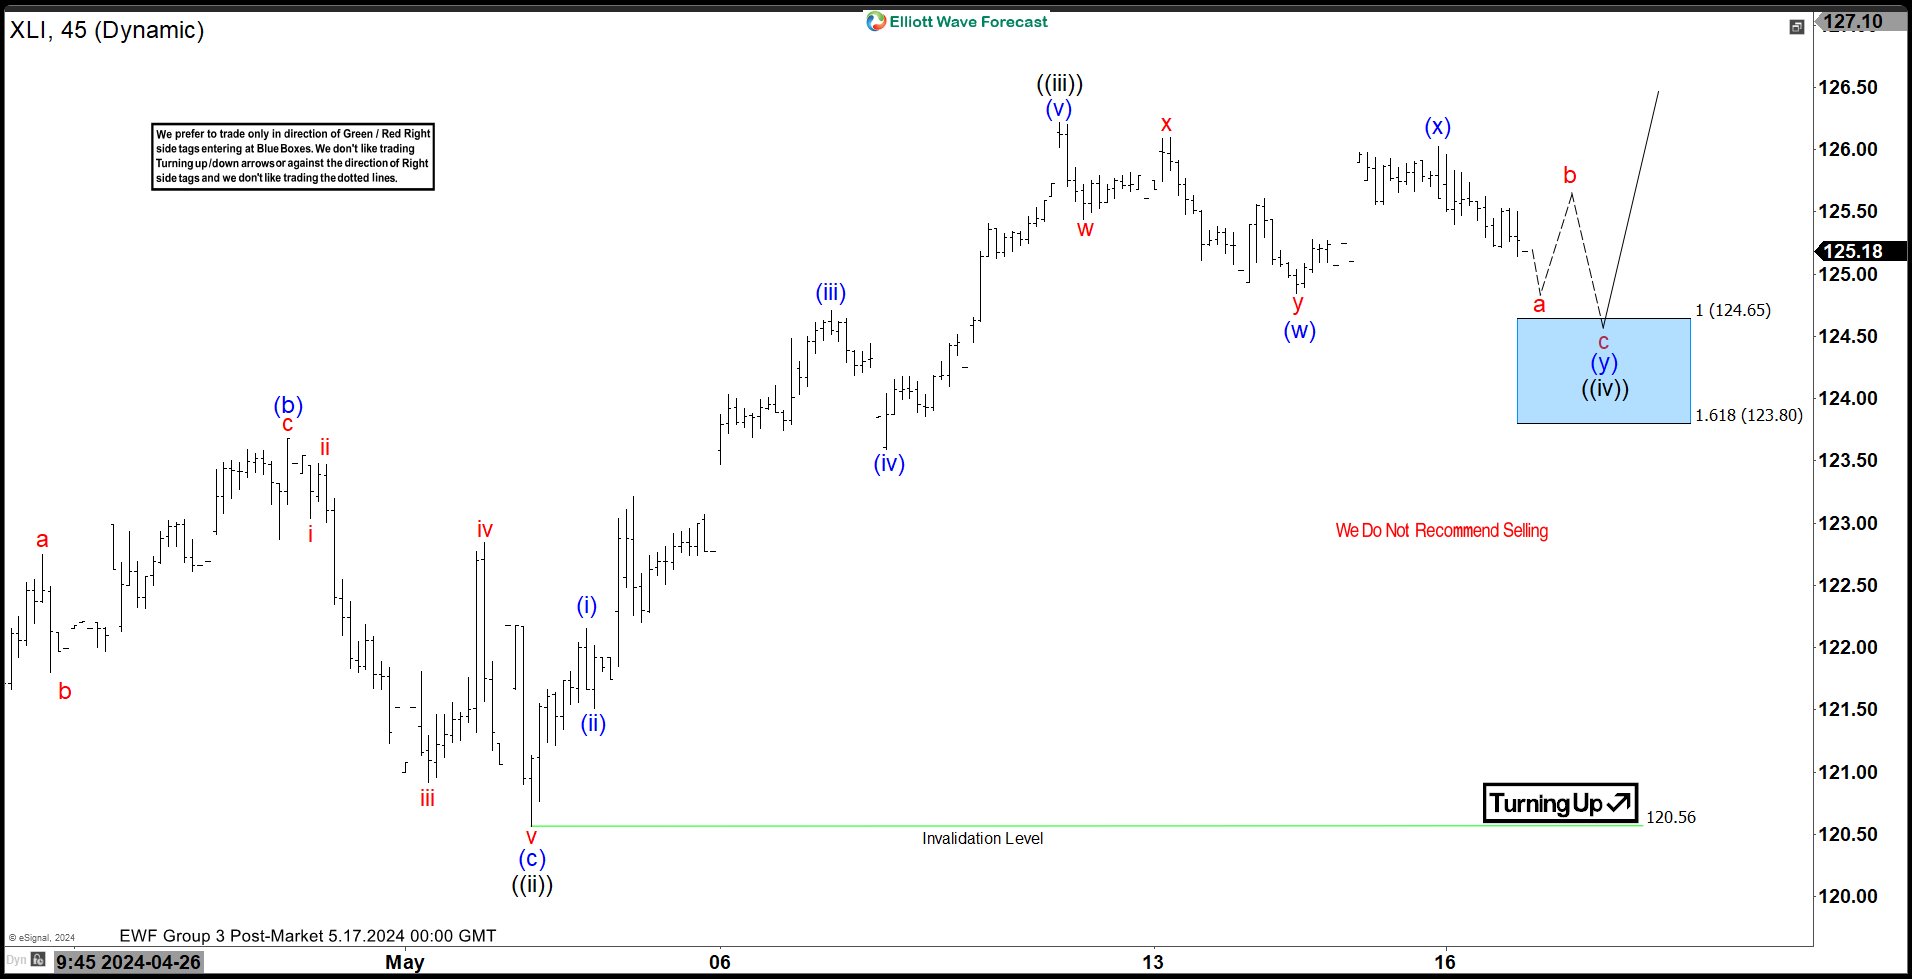 Here is the 1H Elliott Wave count from 5.17.2024. We expected the pullback to find buyers at the blue box area at 124.65 – 123.80 in 7 swings.
$XLI 1H Elliott Wave Chart 5.20.2024:
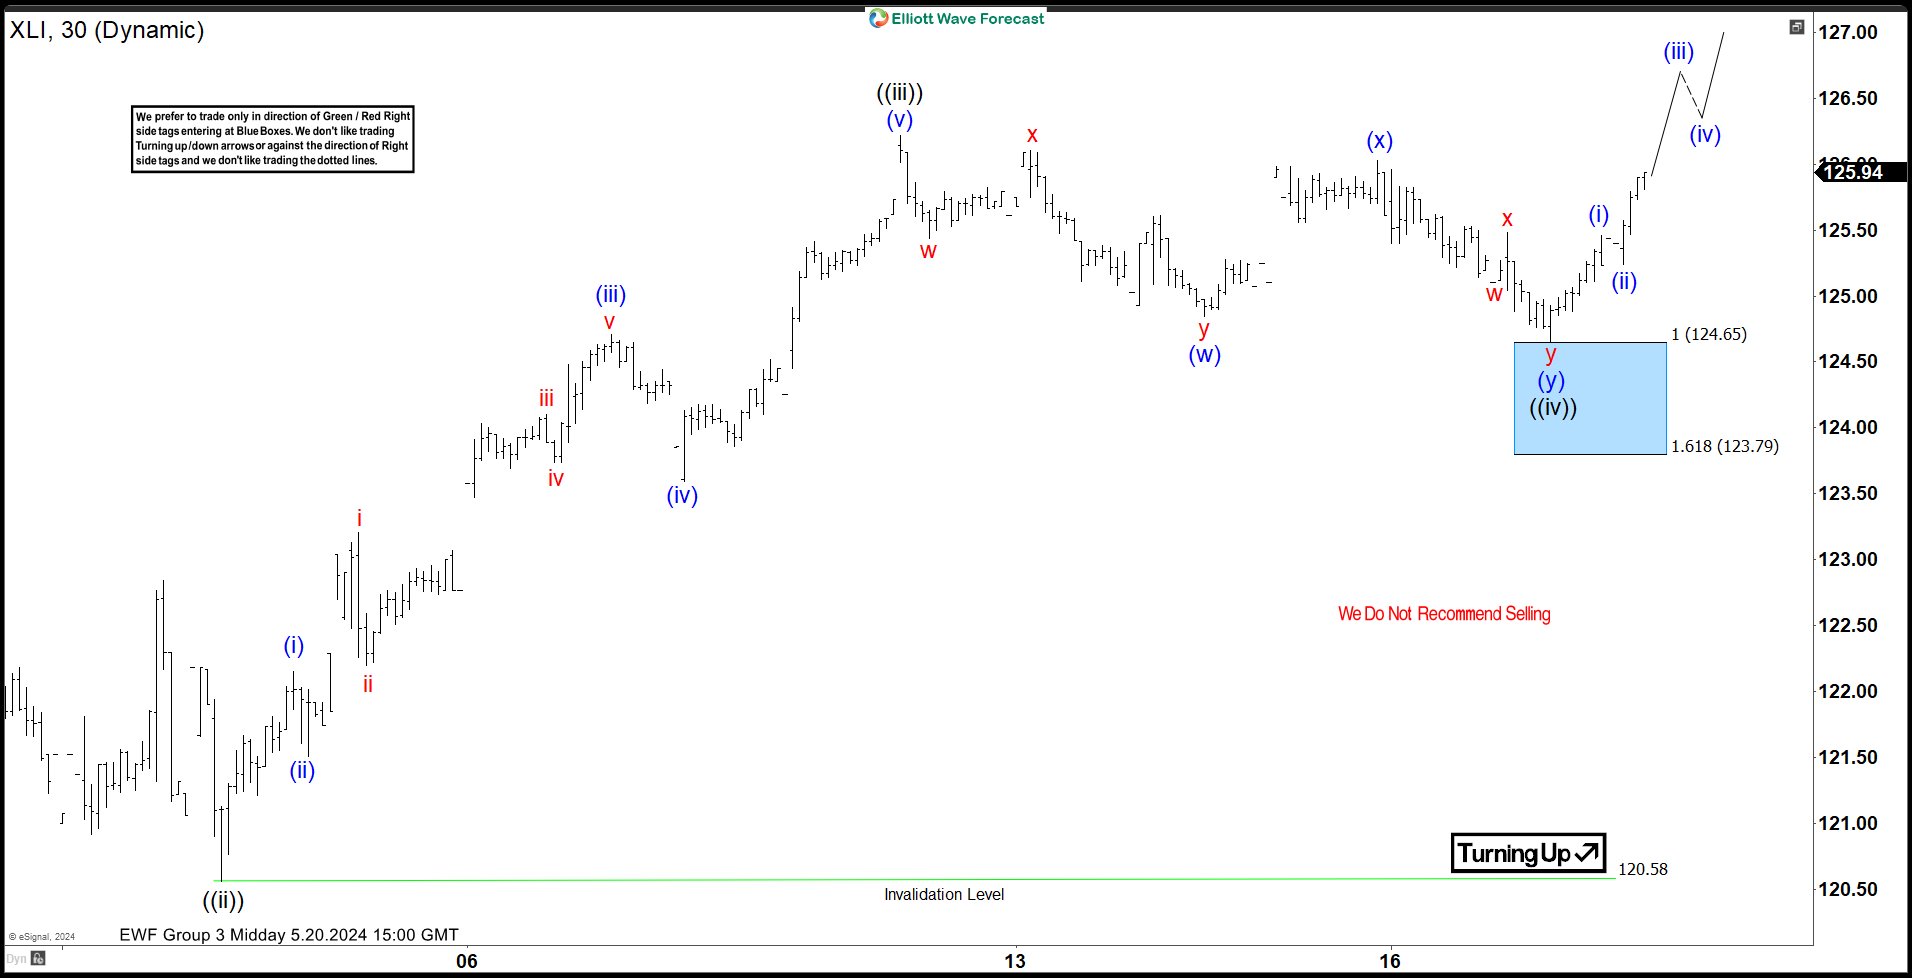 Here is the latest 1H update from 5.20.2024 showing the bounce taking place as expected. The ETF has reacted higher from the blue box area allowing longs to get risk free. The ETF is expected to trade higher towards $128 – 130 before another pullback can happen.
Source: https://elliottwave-forecast.com/stock-market/industrial-etf-xli-blue-box-area/



Comments
Log in or sign up to join the conversation.