
7% Off the Lows
The S&P gained 2.5% today and had its sixth straight positive day on news of the Iran ceasefire.
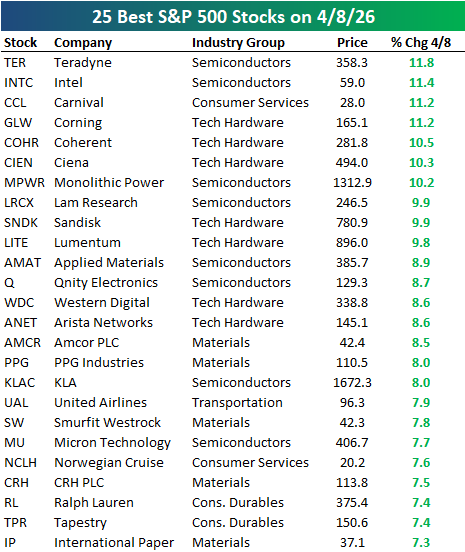
As shown below, the biggest winners came from Semis, Tech Hardware, and Consumer stocks:
Since the lows at the end of March, the S&P has rallied 7% and is now a little more than 2% away from all-time highs.
Notably, the S&P closed back above both its 50-DMA and its 200-DMA, something that has occurred fewer than 20 times (for the first time in at least a month) since 1953 when the current five-day trading week began.
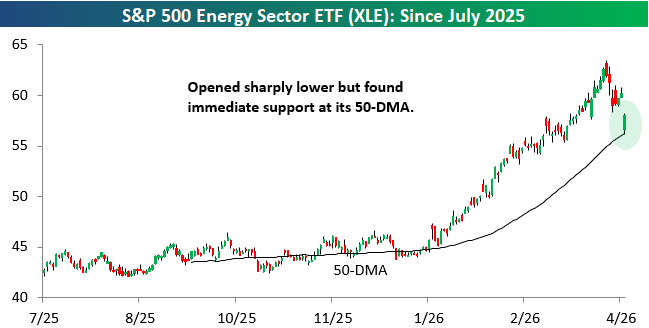
Energy Bounces Off Its 50-DMA
Before you go, take a quick look at the bounce the Energy sector ETF (XLE) saw off its 50-DMA this morning after a big gap down:


Comments
Log in or sign up to join the conversation.