

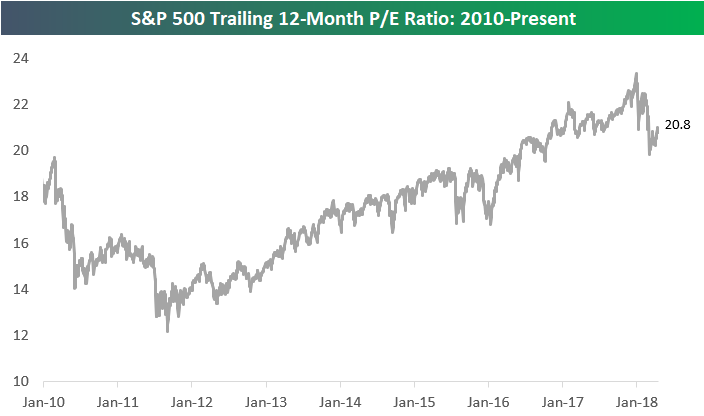
As of yesterday, the S&P 500’s trailing 12-month P/E ratio stood at 20.8. The high point for the S&P’s P/E ratio for the current bull market was 23.34 hit on January 26th, which was the same day the index made its last all-time high in price. Since those highs, the P/E has contracted by 2.54 points.
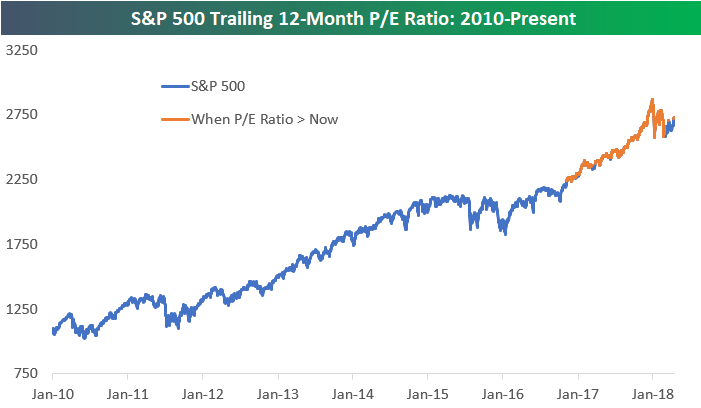
Below is a chart of the S&P 500’s price since 2010. The orange line represents periods when the S&P 500’s P/E ratio has been higher than it is now (>20.80). As shown, the index basically traded at a higher valuation than now for the entirety of 2017’s big rally.
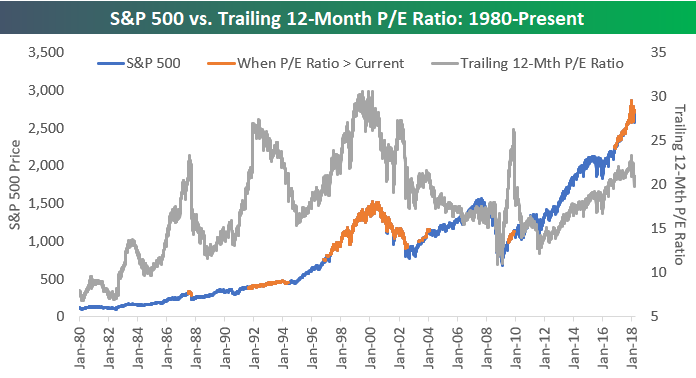
Below we show the S&P 500’s price vs. P/E ratio going back to 1980. Once again, the S&P’s price is highlighted in orange when the index’s P/E ratio has been greater than 20.8. As shown, the S&P traded at a higher valuation than now from 1992 through early 1994 and again from mid-1997 through early 2002. During the 2003-2007 bull market, we actually saw P/E contraction that kept it below 20 up until the index peaked in October 2007.

Comments
Log in or sign up to join the conversation.