

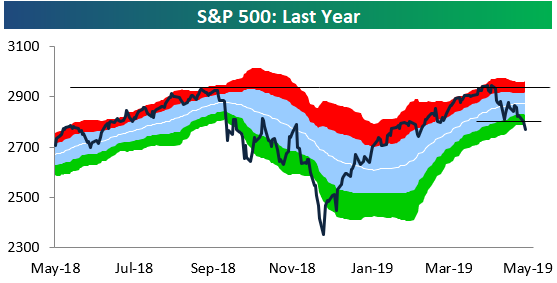
Below is an updated look at the S&P 500’s trading range chart over the last year. After just barely making a new 52-week high in April, it has been all downhill since, with the index currently trading in extreme oversold territory at two standard deviations below its 50-day moving average. Yesterday’s declines caused more technical damage when the index broke below its lows from a few weeks ago. Right now the bears have control and the onus is on the bulls to break the short-term downtrend that’s in place.
(Click on image to enlarge)
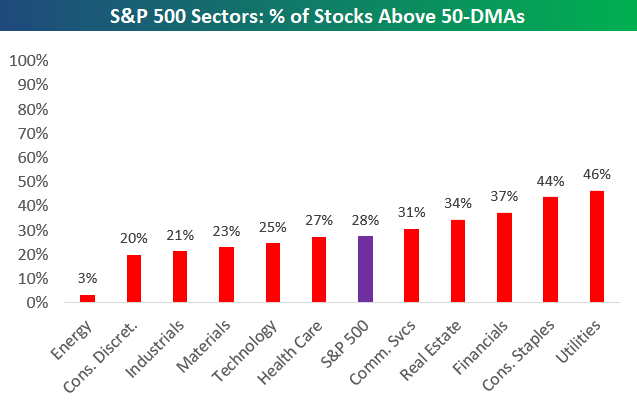
The defensive areas of the market like Consumer Staples and Utilities had been holding up well up until this week, but even these non-cyclicals have started to experience significant selling. The declines for defensives have left every single S&P 500 sector with less than 50% of its stocks above their 50-day moving averages. As shown below, just 28% of S&P 500 stocks and 3% of those in the Energy sector are above their 50-DMAs.The largest sector of the market — Technology — currently has a very weak reading of just 25% as well.
(Click on image to enlarge)



Comments
Log in or sign up to join the conversation.