


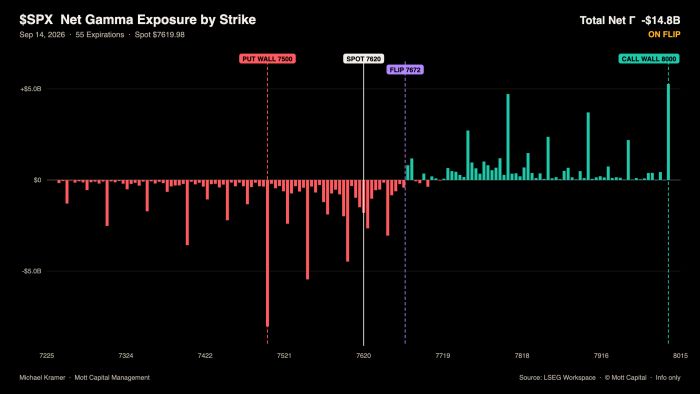
The S&P 500 retreated by about 50 basis points today, finishing above its early morning lows but below its session highs. The area around 7,600 is proving to be a key level, with a sizable amount of options gamma appearing to help support the index. However, that gamma support appears weaker heading into tomorrow’s session, potentially leaving the level more vulnerable if it is not rebuilt through today’s trading activity.
With options expiration this week, positioning could contribute to a pinning effect, potentially keeping the index near the put wall.
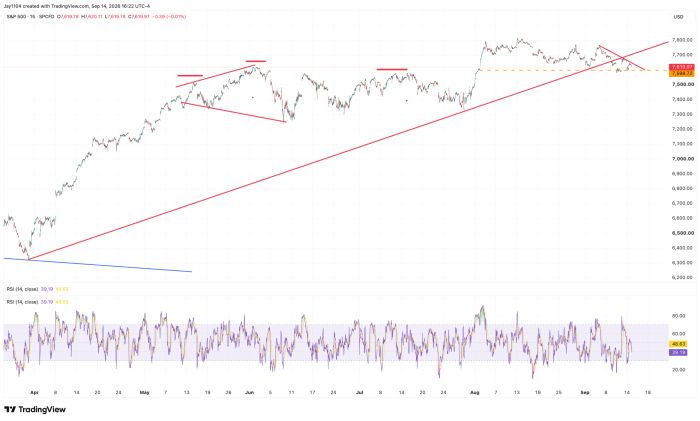
The technical chart suggests that if support at 7,600 breaks, there is little nearby technical support below it. The uptrend from the March lows has already broken, and a subsequent retest has failed. With a descending triangle also in place, a gap lower tomorrow could lead to a break below 7,600.
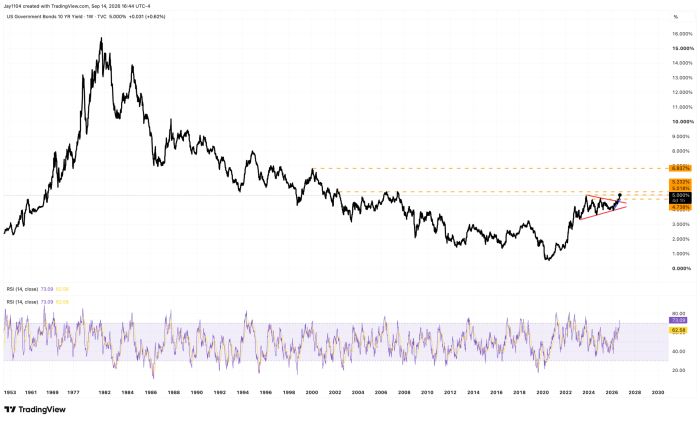
The 10-year Treasury yield briefly moved above 5% today before pulling back to close at 4.99%, matching its October 2023 closing high. In my view, the Fed is less inclined to push yields lower this time. In November 2023, it changed its statement to refer to “tighter financial and credit conditions”, rather than just “tighter credit conditions”. My read today is that the Fed wants the market to play ball—and that is exactly what it is doing.
What else is different? The anchor that low Japanese yields provided for global rates has lifted, with the 10-year Japanese government bond yield now at 3%, compared with roughly 0.95% back then. That makes today’s landscape very different from what it was three years ago.
Looking at the weekly chart of the 10-year Treasury yield, it is hard for me not to see a bullish pattern for yields, suggesting they could move substantially higher. I know some readers have pushed back on this view for years, but I continue to believe rates have been too low for too long. The 5%–5.25% region is now crucial. A break above 5.25% could bring 6.8% into view as the next major technical level.

Comments
Log in or sign up to join the conversation.