

The S&P 500’s trailing 12-month P/E ratio got down into the low 15s at the bottom in late December, but we’ve seen huge P/E expansion as the market has rallied back. As of this afternoon, the S&P’s trailing 12-month P/E sits at 18.61. Even still, that’s well below readings in the 20s that were seen for a number of weeks in 2018.
(Click on image to enlarge)

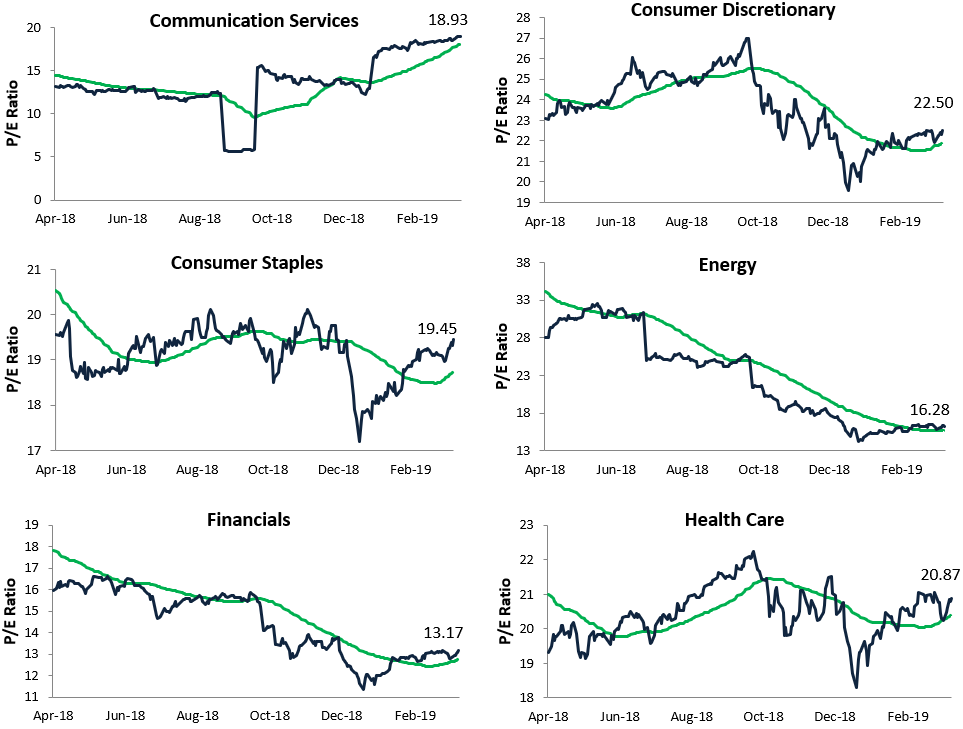
Below we show one-year P/E ratio charts for major S&P 500 sectors. Since the December lows, we’ve seen P/E expansion in every sector, but the one that stands out the most is Utilities.
You can see the spike up to 19.80 in the one-year chart for Utilities below. At 19.80, only Technology, Health Care, and Consumer Discretionary have higher trailing 12-month P/E ratios than Utilities right now.
(Click on image to enlarge)
(Click on image to enlarge)




Comments
Log in or sign up to join the conversation.