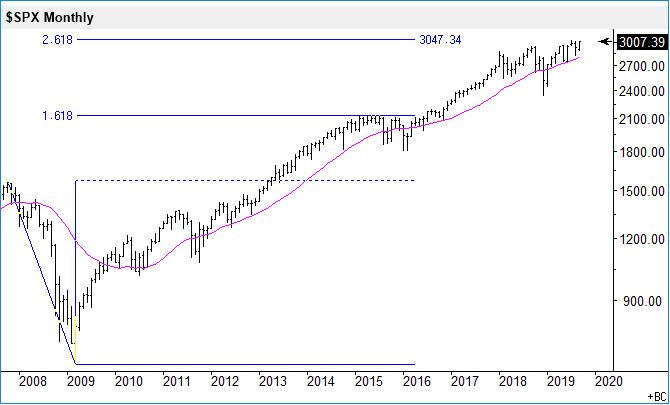
The S&P 500 benchmark index is 40 points away from 2.618% fib extension. The trend is clearly up with a rising moving average line under the index levels.
Below is a monthly chart of the S&P 500 index on a semi-log scale. The trend is clearly up with a rising moving average line under the index levels. A fibonacci extension from 2007 high to 2009 low gives a target at 3047 (2.618%) or 40 index points above the current level. I expect the index to at least pause there. Note how the index stopped right at the 1.618 extension level in 2015 before going higher in 2016.
Disclosure:
The analysis provided here is usually part of the analysis the author uses when he is designing and managing his investment portfolios. Disclaimer: The analysis presented here is for informational purposes only. Readers are solely responsible for their own investment/trade decisions.


Comments
Log in or sign up to join the conversation.