

In this technical blog, we are going to take a look at the past 1-hour performance of Soybean ticker symbol: ZS_F Elliott Wave charts that we presented to our clients. We are going to explain the structure and the forecast below.
Soybean Elliott Wave 1 Hour Chart From November 21.2018
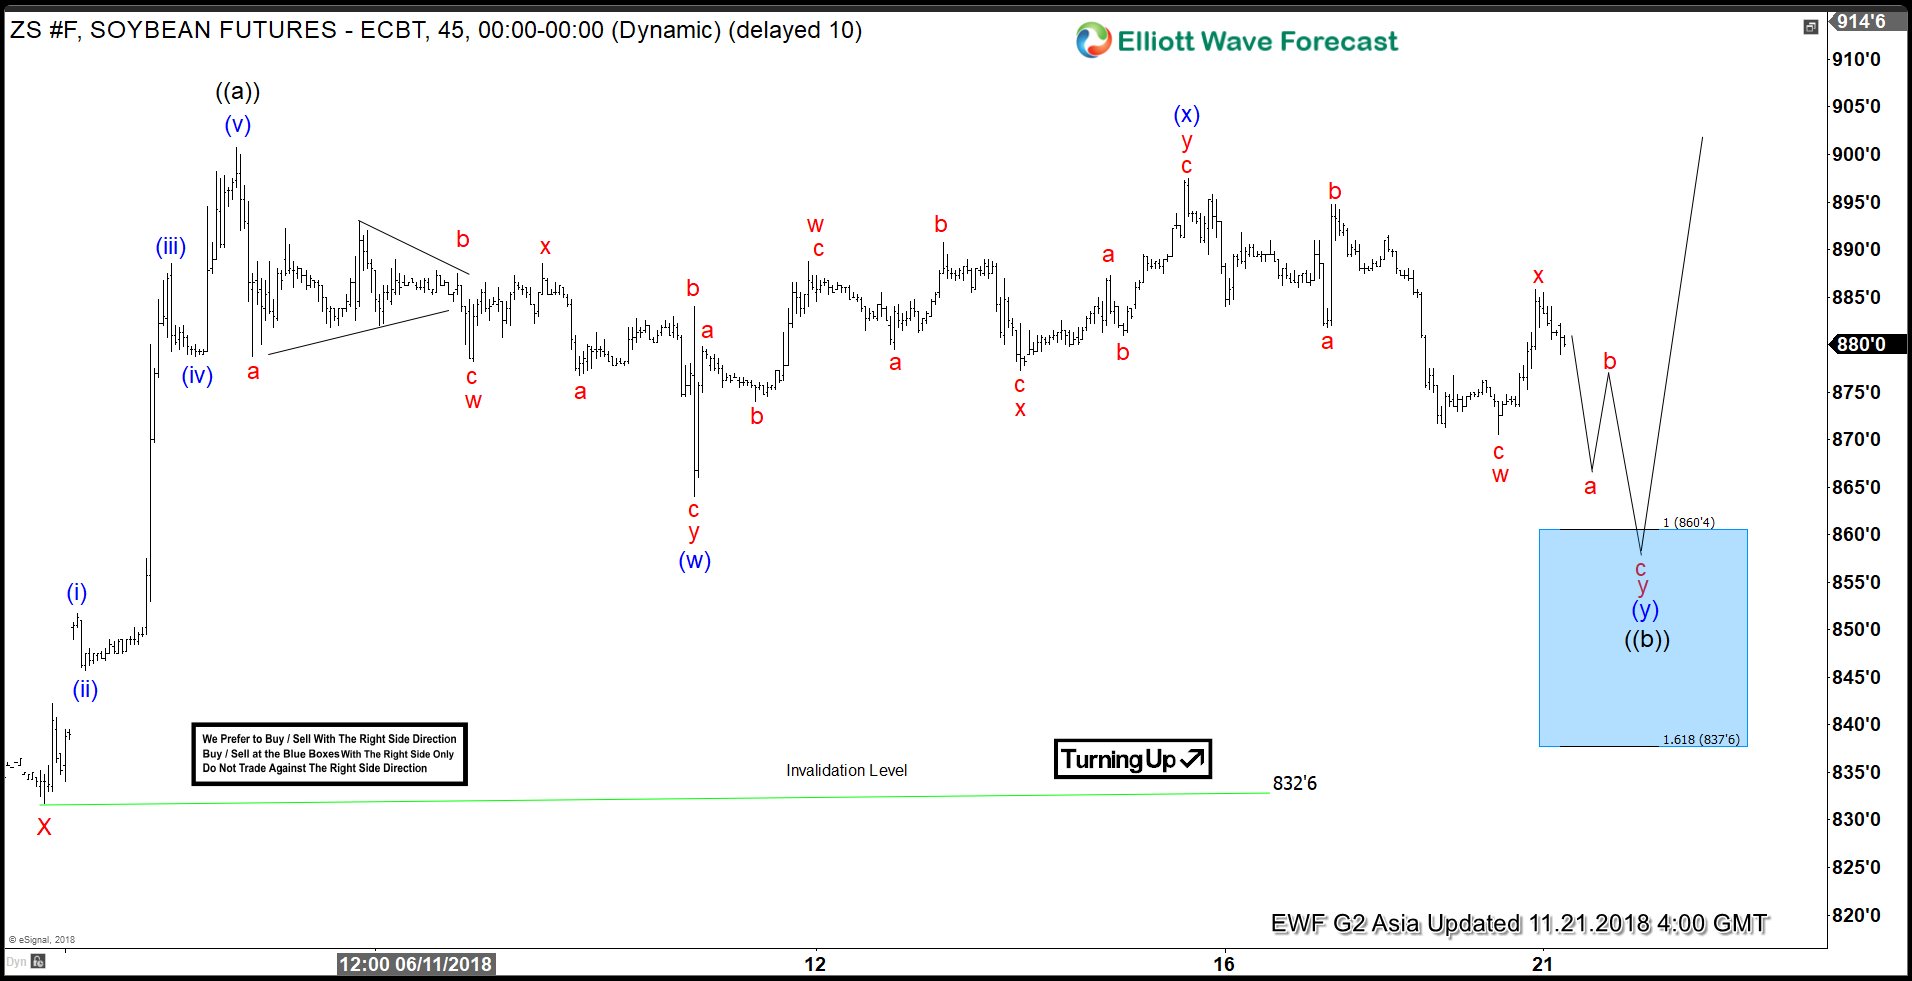
Above is the 1-hour Chart from 11/21/2018 Asia update, in which instrument was expected to correct the short-term cycle from 10/31/2018 low (832.6) in Minute wave ((b)). The internals of that pullback was expected to unfold in lesser degree double three structure. And see a push lower towards 860.4-837.6 100%-161.8% Fibonacci extension area of a Minutte wave (w)-(x) before next leg higher within Minute wave ((c)) starts.
Soybean Elliott Wave 1 Hour Chart From November 28.2018
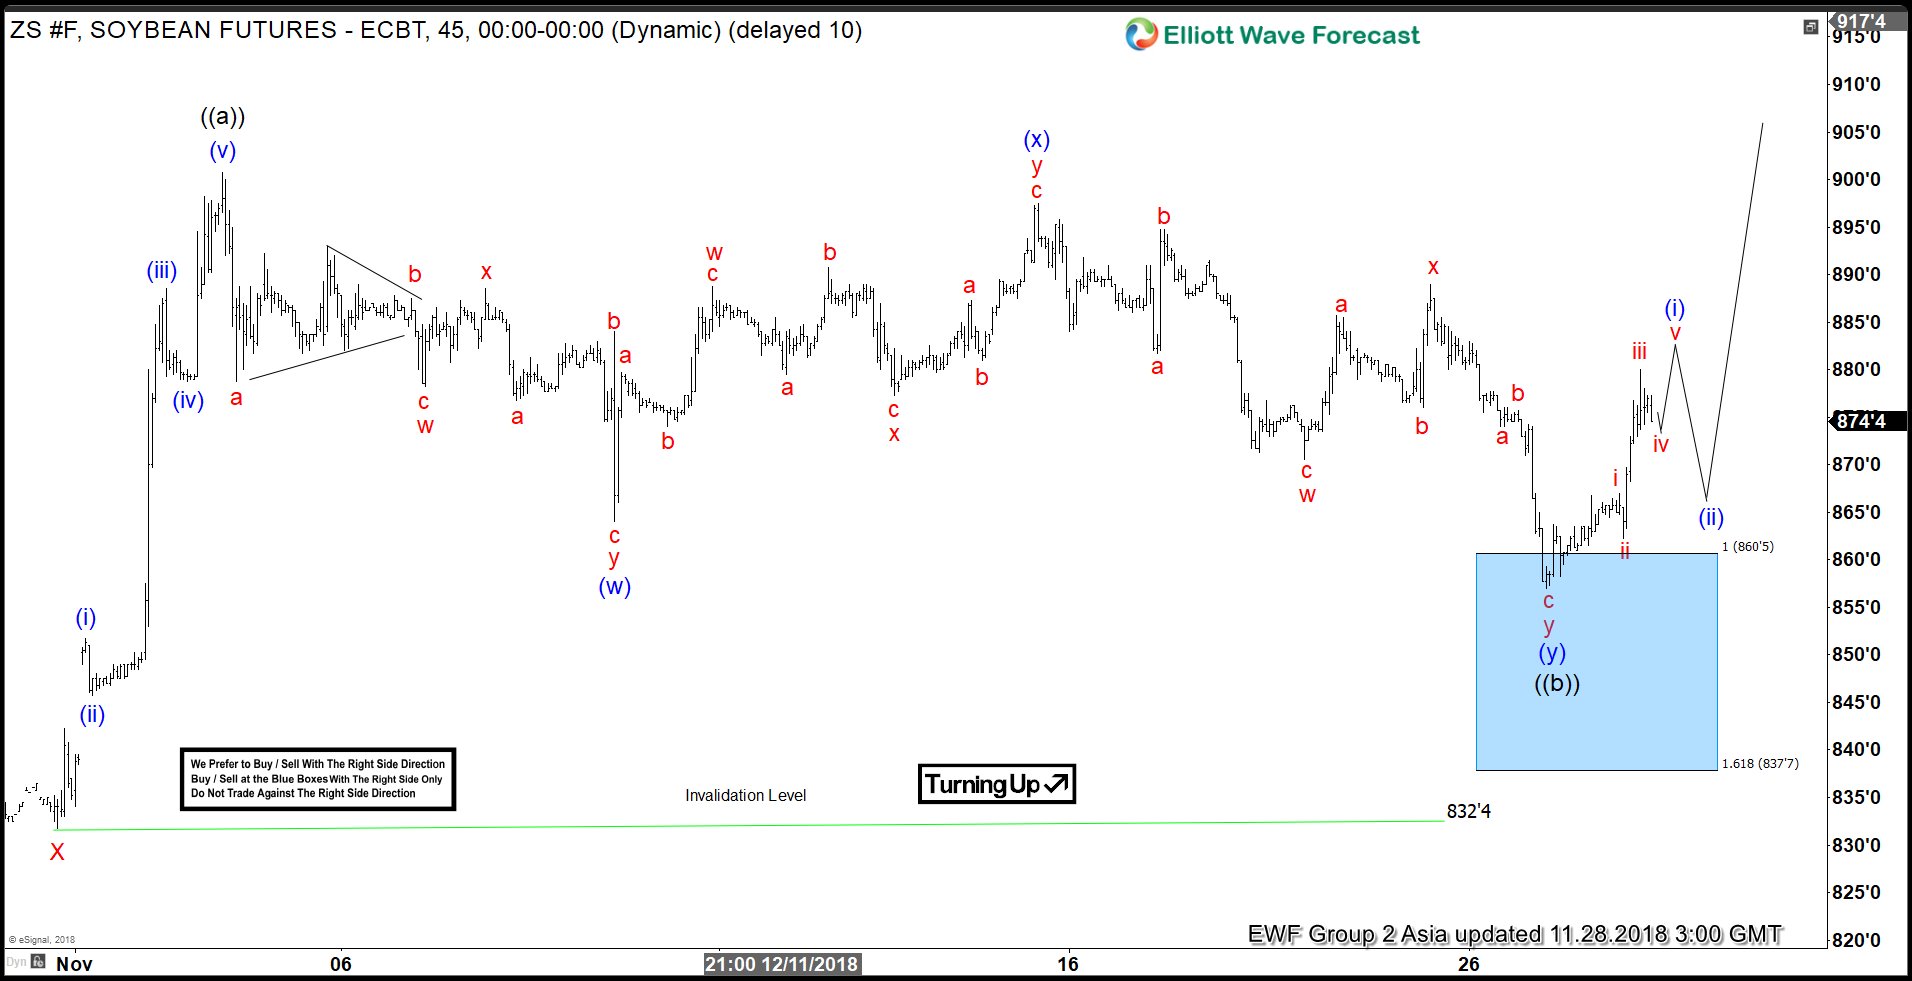
Soybean 1-hour Chart from 11/28/2018 Asia update, the instrument reached the blue box area last week in 7 swings at 860.4-837.6 as expected and ended the Minute wave ((b)) at 857 low. While above there, the instrument was expected to resume the next leg higher within Minute wave ((c)) of a proposed zigzag structure coming from 10/31/2018 low.
Soybean 1 Hour Elliott Wave Chart From December 02.2018
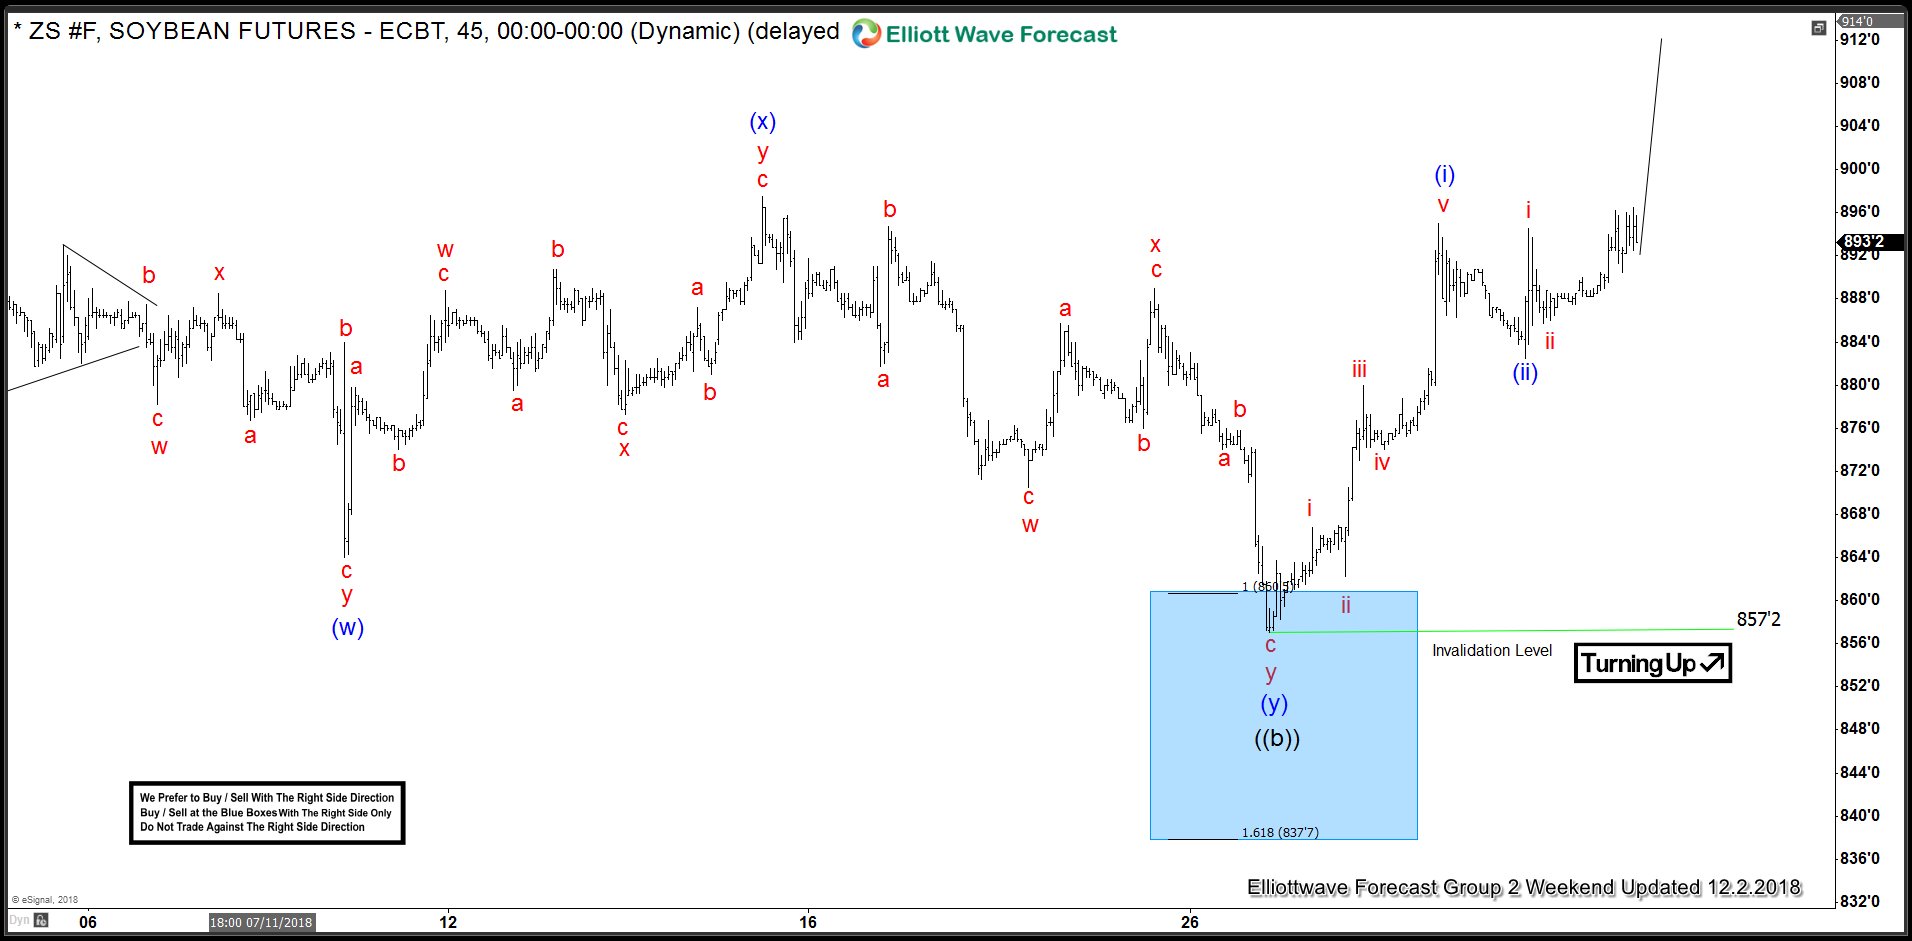
Here's the 1-hour update from 12/02/2018 Weekend update. Showing instrument breaking to new highs already, after finding buyers from the blue box area confirming the next extension higher.



Comments
Log in or sign up to join the conversation.