


Back on September 28, we discussed how Solana's five-wave impulse on the daily chart could offer another bullish opportunity after a wave 4 pullback. Our initial analysis highlighted the $110–$95 support zone as an important area to watch. Read the original analysis here.
Since then, SOL has progressed further, completing wave (5) of 3 on the 4-hour chart and entering a higher-degree wave 4 correction. Price is now testing the 38.2% Fibonacci retracement and the upper line of the base channel around the psychological $100 level, which could act as the first ideal support.
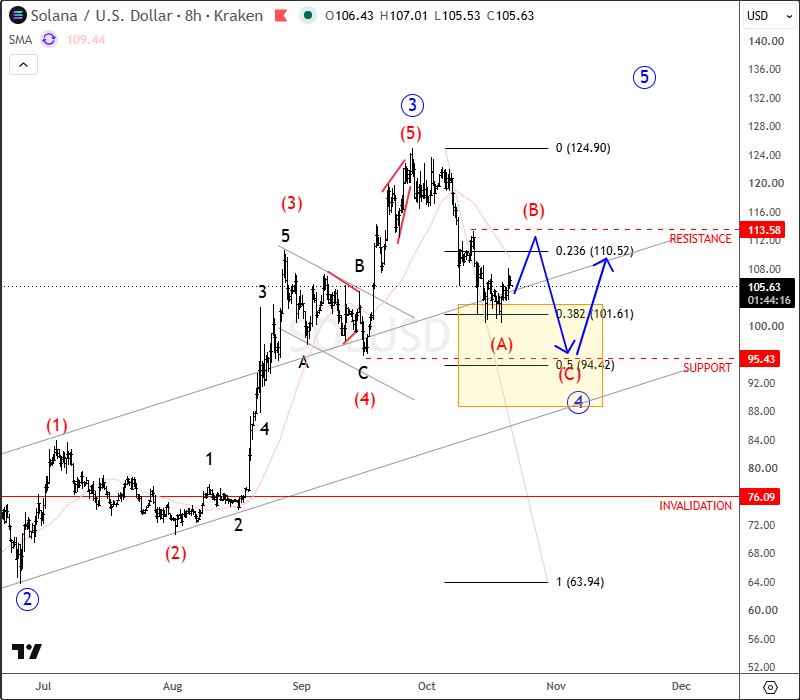
However, the sharp decline from the highs may represent an impulse within wave (A), suggesting that wave 4 could unfold as a three-wave ABC correction. In this scenario, the broader $100–$95 zone becomes an important support area from which a bullish resumption within wave 5 could develop.
For now, we should watch for a temporary recovery within wave (B) toward the $113 resistance level before a potential additional decline within wave (C). The reaction around these key levels should help us assess whether SOL is preparing for the next bullish leg.



Comments
Log in or sign up to join the conversation.